

L'Ape Baguette 🥖 Learning: Fibonacci Retracement
L'Ape Baguette 🥖 Learning: Fibonacci Retracement
Do you know Fibonacci Retracement? Read this guide to help you use one of the best trading indicators.

Summary
Introduction
What is Fibonacci Retracement Indicator?
How to use this indicator?
Level Expansion
Real Example
Conclusion
1. Introduction
Why “Fibonacci”? The Fibonacci retracement is so named because its method is based on the sequence of numbers discovered by Leonardo Fibonacci, an Italian mathematician of the 12th century. Here is how this list of numbers is composed: 1, 1, 2, 3, 5, 8, 13, 21, 34, 55, 89, 144, 233, 377, etc.
It is actually a simple calculation where the numbers that make it up are calculated by adding the two numbers that immediately precede them.
2. What is Fibonacci Retracement Indicator?
During the evolution of a stock market index, we often see consolidation and correction phases. As I often tell you, these phases are very important and help to build a healthy trend over the long term.
Therefore, when an asset performs a pullback for example, it is also called a retracement and this is where the "Fibonacci Retracement" indicator comes into its own because it allows you to easily and accurately identify the amplitude of these movements.
3. How to use this indicator?
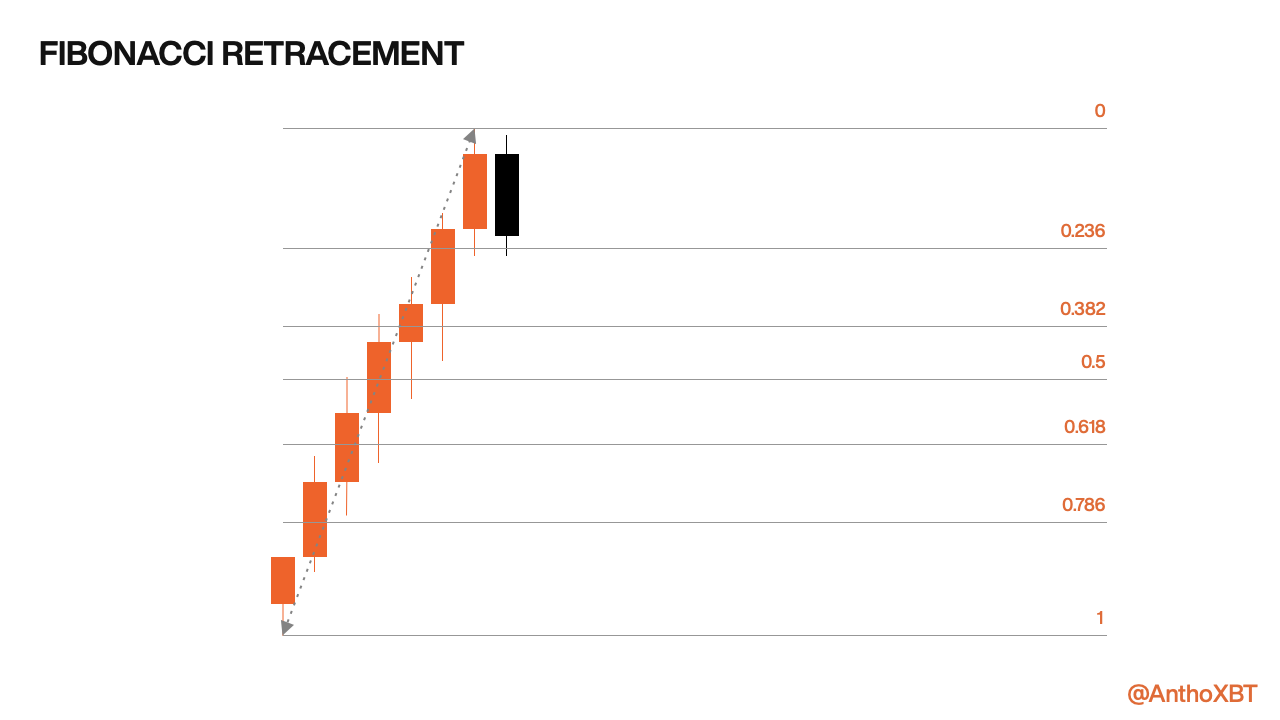
In this example, there is seven green candles in a row, and the eighth seems to be a reversal candle. So we draw a Fibonacci retracement. To draw it, it's very simple, just take the high and low points of the trend.
By default, you will see seven lines appear. Each line represents a level of retracement (in %): 0, 0.286, 0.382, 0.5, 0.618, 0.786 & 1.
Here, Fibonacci indicator helps you to spot different potential support in the pullback.
Do you want to learn more? Discover our full article on patterns & indicators. Read it now! →
Now let's imagine that a 50% retracement of the previous trend occurs, this is what it will look like:

A 50% retracement of a trend is often very healthy and allows new highs to be reached when the uptrend resumes.
Attention, I am not saying that in all cases, a correction does not reach more than 50%, it is possible that a retracement is more than 100%.
Well, it's as simple as that, this indicator is one of my favorite and it’s really easy to use.
Now, let's see how we can "magically" make a target price appear that we have trouble identifying.
4. Level Expansion
Ok, in this example let’s imagine we were in a downtrend and we draw Fibonacci Retracement Levels:

Here, once the downtrend was complete, we traced a Fibonacci retracement, and 100% of the downtrend was retraced. Most of the time, the fib expansion helps you to find the following potential resistance. You can add theses levels in the indicator settings on TradingView.
5. Real Example

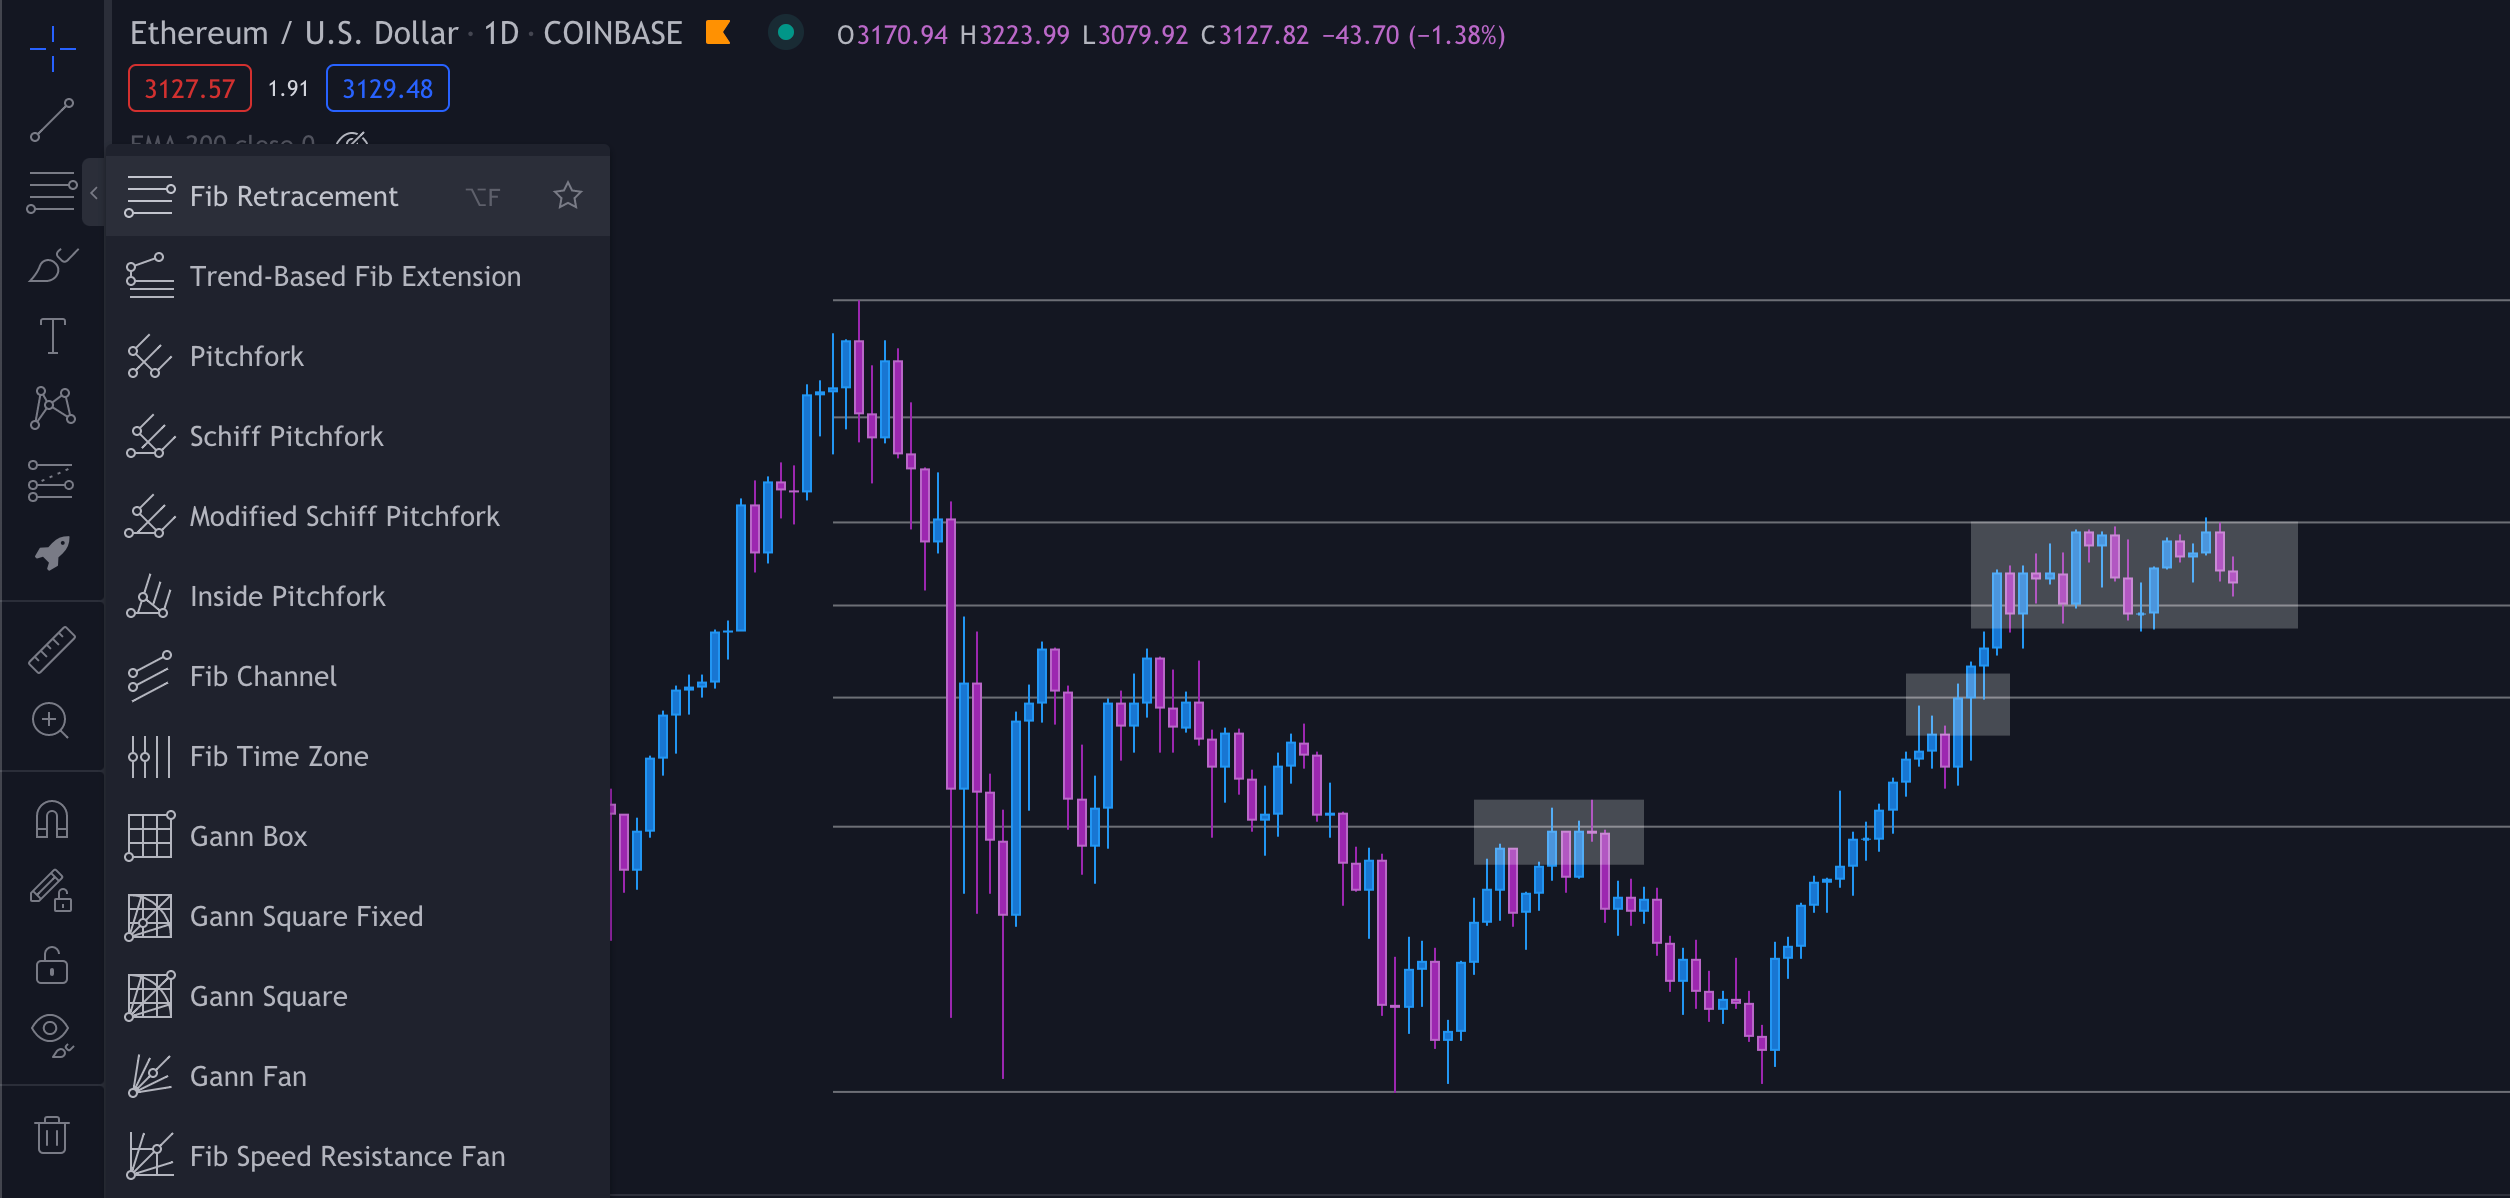
Here is the current daily chart of Ethereum. As you can see, the Fibonacci levels are very accurate and they have acted as resistance and support each time a breakout has occurred.
Once the entire previous move is retraced, the next potential target would be at $6,500 based on the 1.782 fib level.
6. Conclusion
If you’re following l’Ape Baguette 🥖 newsletter, you may have noticed that I use this indicator on every chart. I really like it because it is really easy to use and allows to highlight very important levels with extreme accuracy.
To find this indicator on TradingView:
If you like it, don’t forget to subscribe, share and follow theses account on Twitter: @AnthoXBT & @ApeBaguette