

L'Ape Baguette 🥖 Learning: Patterns, Indicators & Guides
L'Ape Baguette 🥖 Learning: Patterns, Indicators & Guides
Pattern, Indicators and more... You will find all the educational content I share here. Enjoy!


Don't miss out on upcoming newsletters! Subscribe for FREE here 👇🏻
On each Technical Analysis, I try (when I can) to share with you an educational pattern explanation. This post will be updated every time I share a new one so that you can easily find them.
Summary
1. Patterns
1.1. Ascending Triangle
1.2. Inverse Shoulder Head Shoulder
1.2.a. Shoulder Head Shoulder (new)
1.3. Wedge
1.3.a. Rising Wedge
1.3.b. Falling Wedge
1.4. Bull Flag
1.5. Pennant
1.5.a. Bullish Pennant
1.5.b. Bearish Pennant
1.6. Inverted Hammer & Shooting Star
1.6.a. Inverted Hammer
1.6.b. Shooting Star
1.7. Accumulation Cylinder (new)
2. Indicators
2.1. RSI Divergence
2.1.a. Bearish Divergence
2.1.b. Bullish Divergence
2.2. Hidden RSI Divergence
2.2.a. Hidden Bearish Divergence
2.2.b. Hidden Bullish Divergence
3. Guides
3.1. Fibonacci Retracement (new)
Glossary
HH: Higher High
HL: Higher Low
LL: Lower Low
LH: Lower High
1. Patterns
Note: All patterns are effective once confirmed. Taking a position while a pattern is being formed exposes you to invalidation and therefore to taking a wrong position..
1.1. Ascending Triangle (Bullish)

Ascending triangles are easy to see. There is a clear and strong resistance with Higher Lows. Each time price reach the resistance, there is a rejection and price drop but found “support” higher that the previous drop.
When it comes to the end of the triangle, the compression is too strong to hold the price below the resistance and most of the time there is a strong breakout.
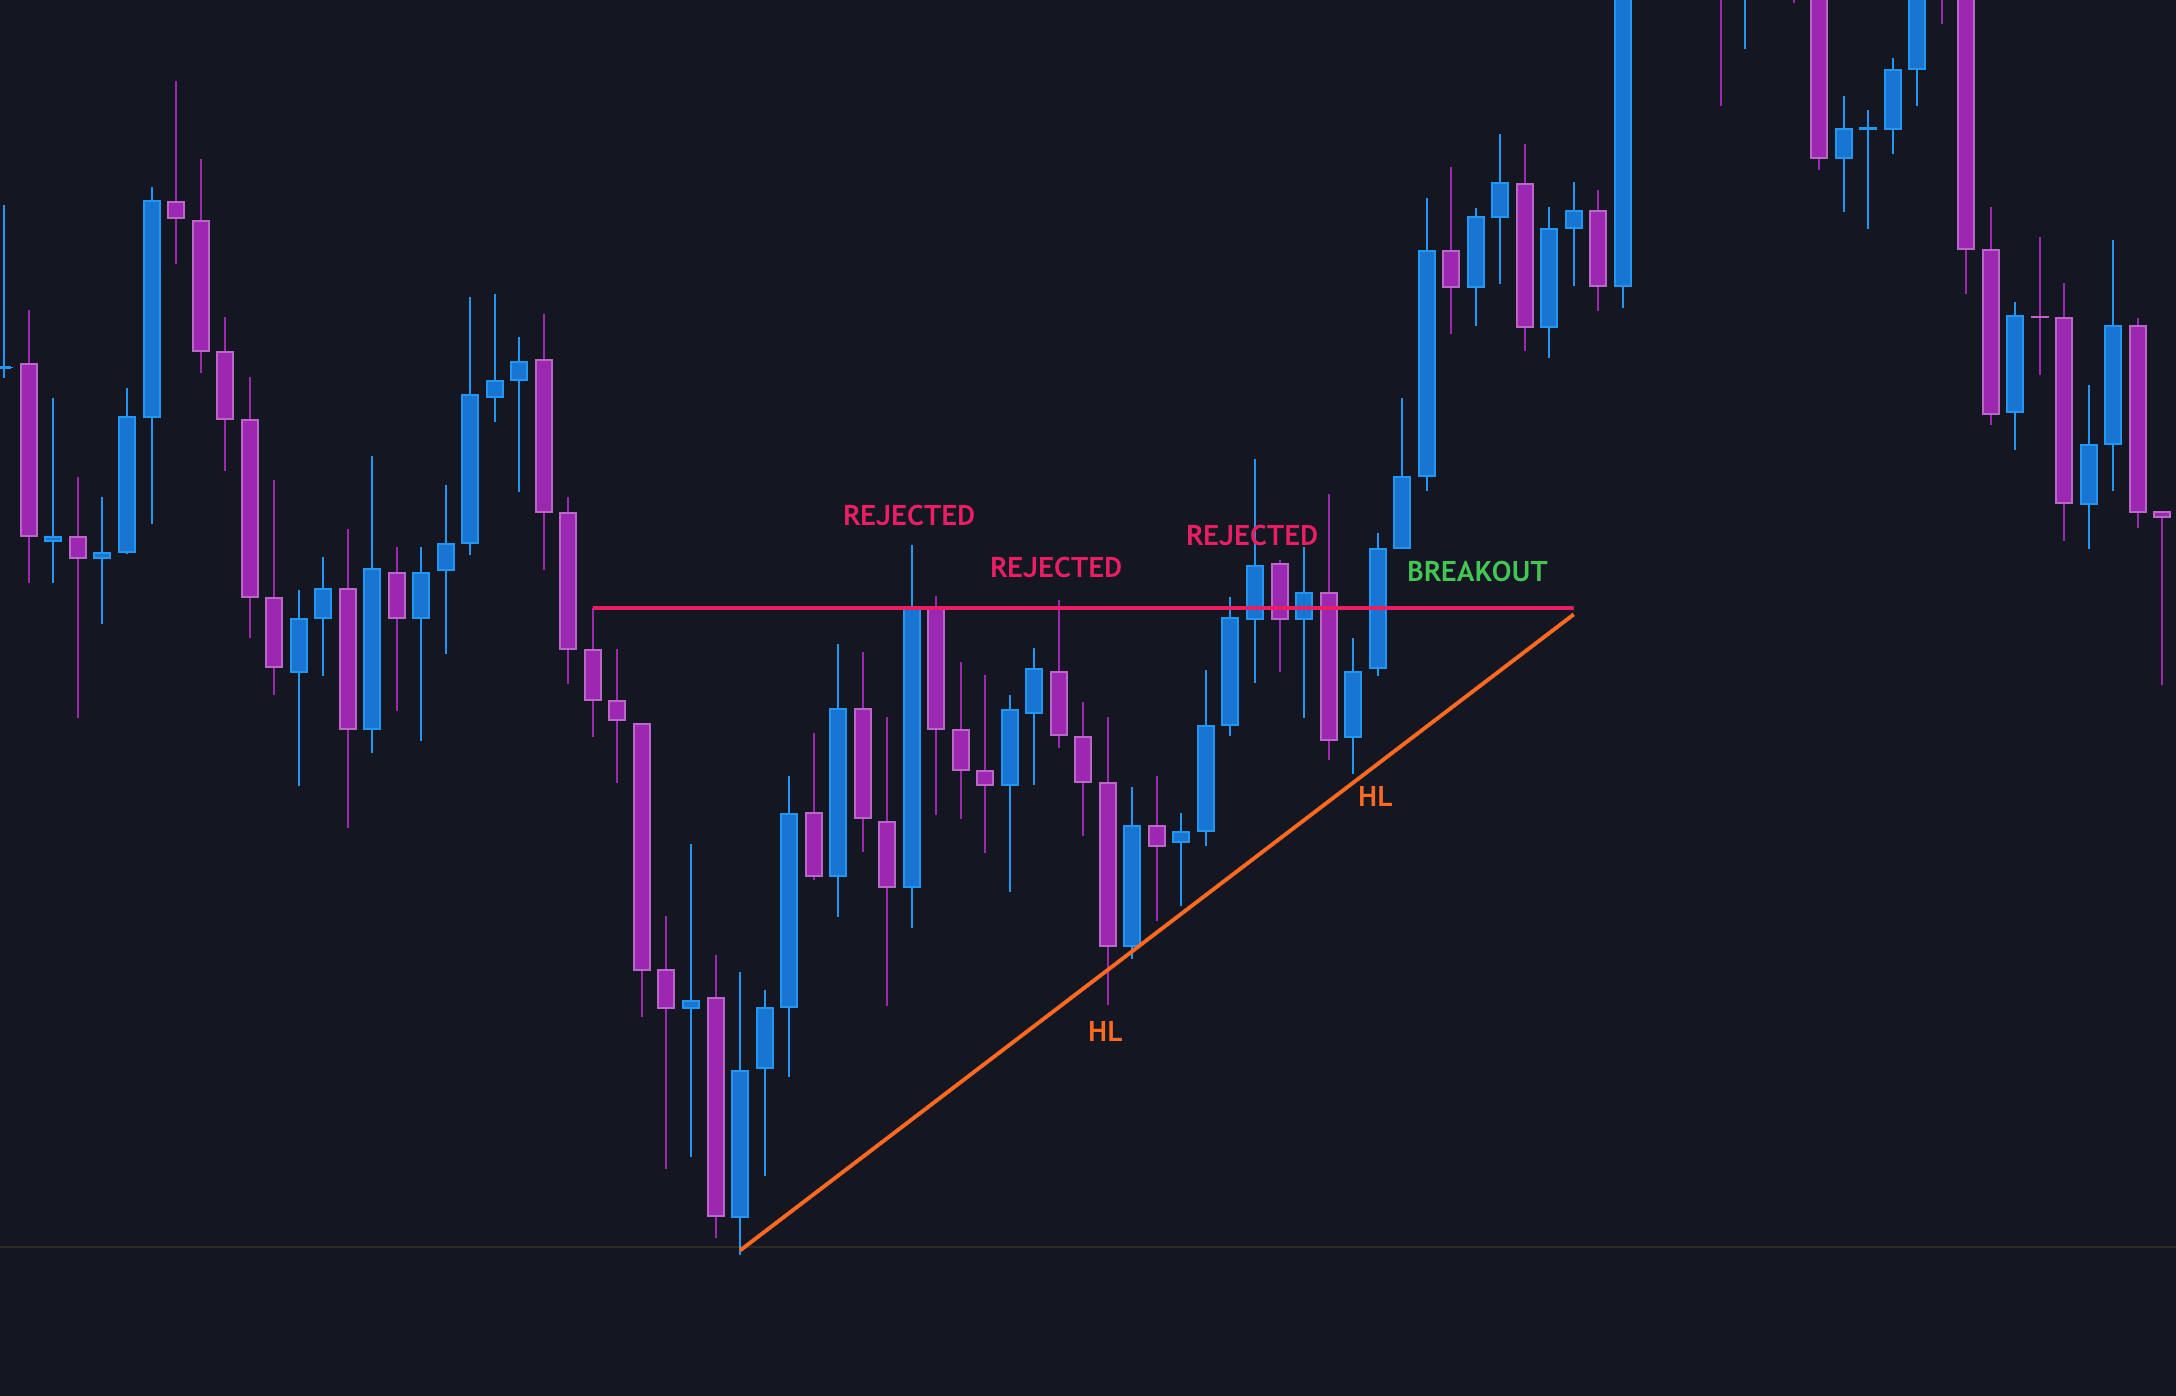
Here an example on Bitcoin’s chart. Clear resistance (red line) with 2 clear rejections and a fake breakout before the real one. As support, there is two higher low which allow you to draw this oblique support from the low point.
1.2. Inverse Shoulder Head Shoulder (Bullish)
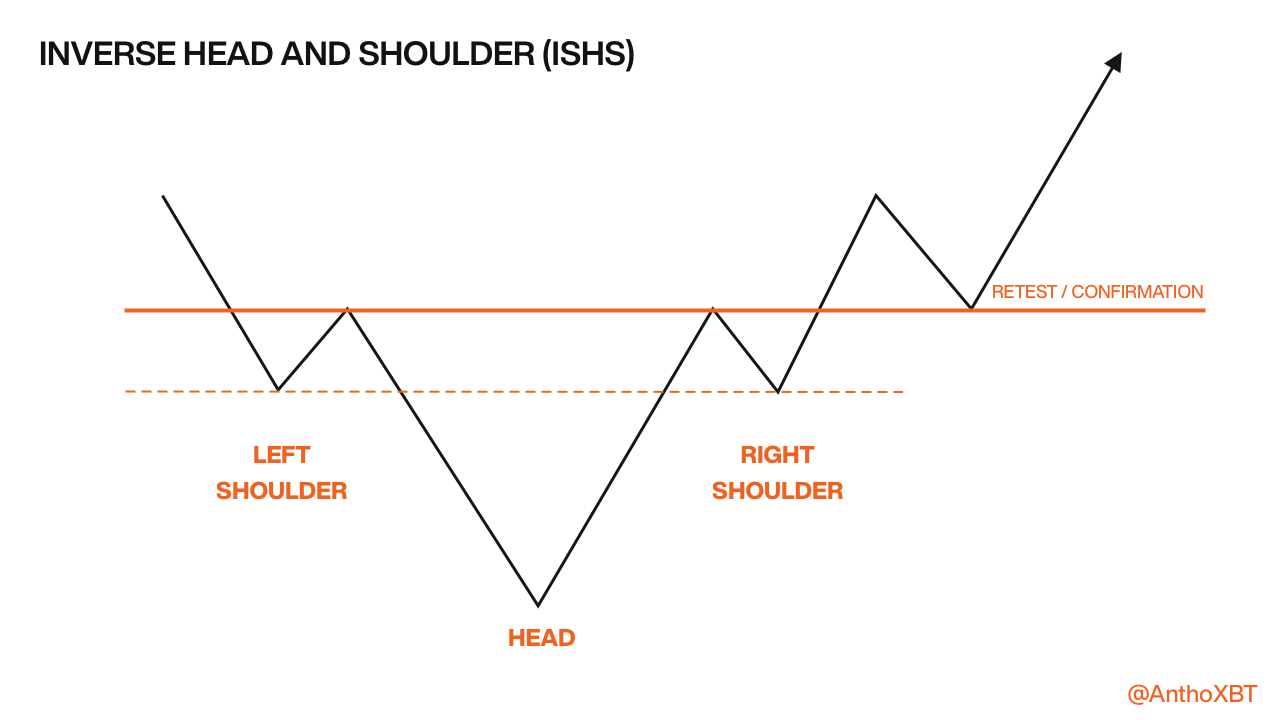
I really love this pattern, because when it works well, breakout are huge.
To get it done, you need to see an initial drop followed by a rebound which is followed by a major drop to support. Then, most of the time we see a V recovery before reaching the first shoulder resistance again. This is followed by a further fall which finds support at around the same level as the first shoulder. Most of the time, when this last shoulder is formed and the price reaches the resistance again, we see a strong breakout.
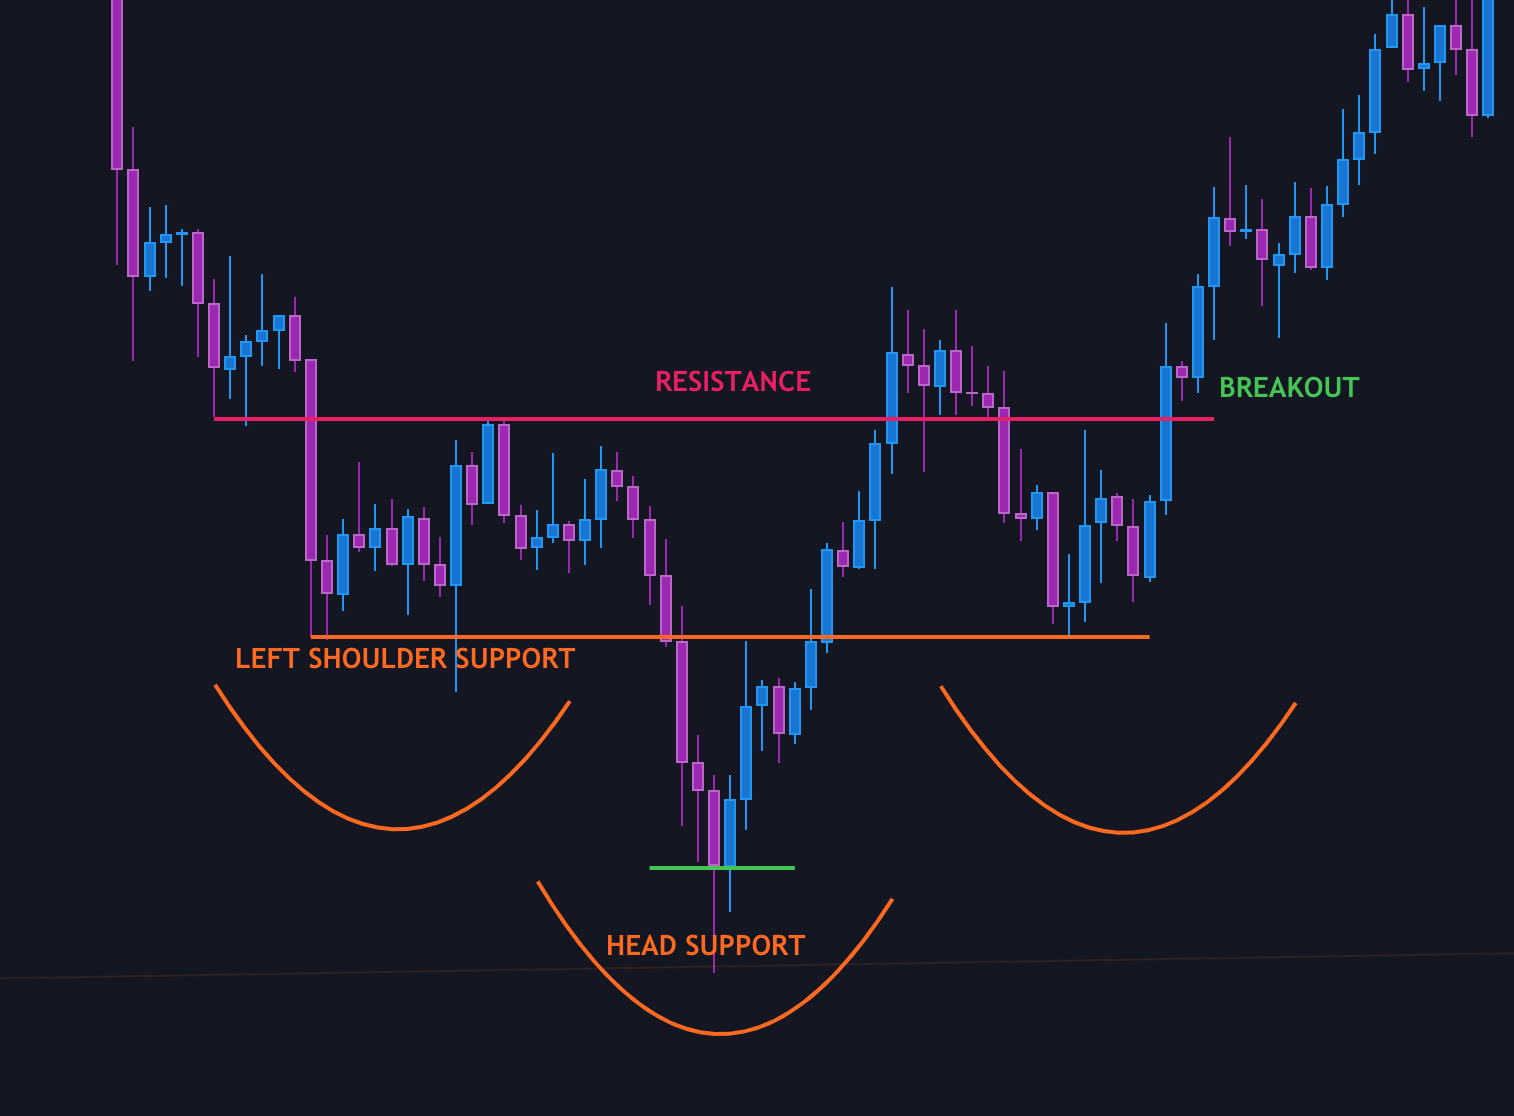
Here an example on the Bitcoin’s chart. Previous support was flip as resistance to print the first shoulder. Then, there was a new resistance test which was rejected to form the head. When the price reached the resistance again, there was a fake breakout which caused the price to fall to form the second shoulder which found support at the same level as the first before bouncing and breaking the resistance.
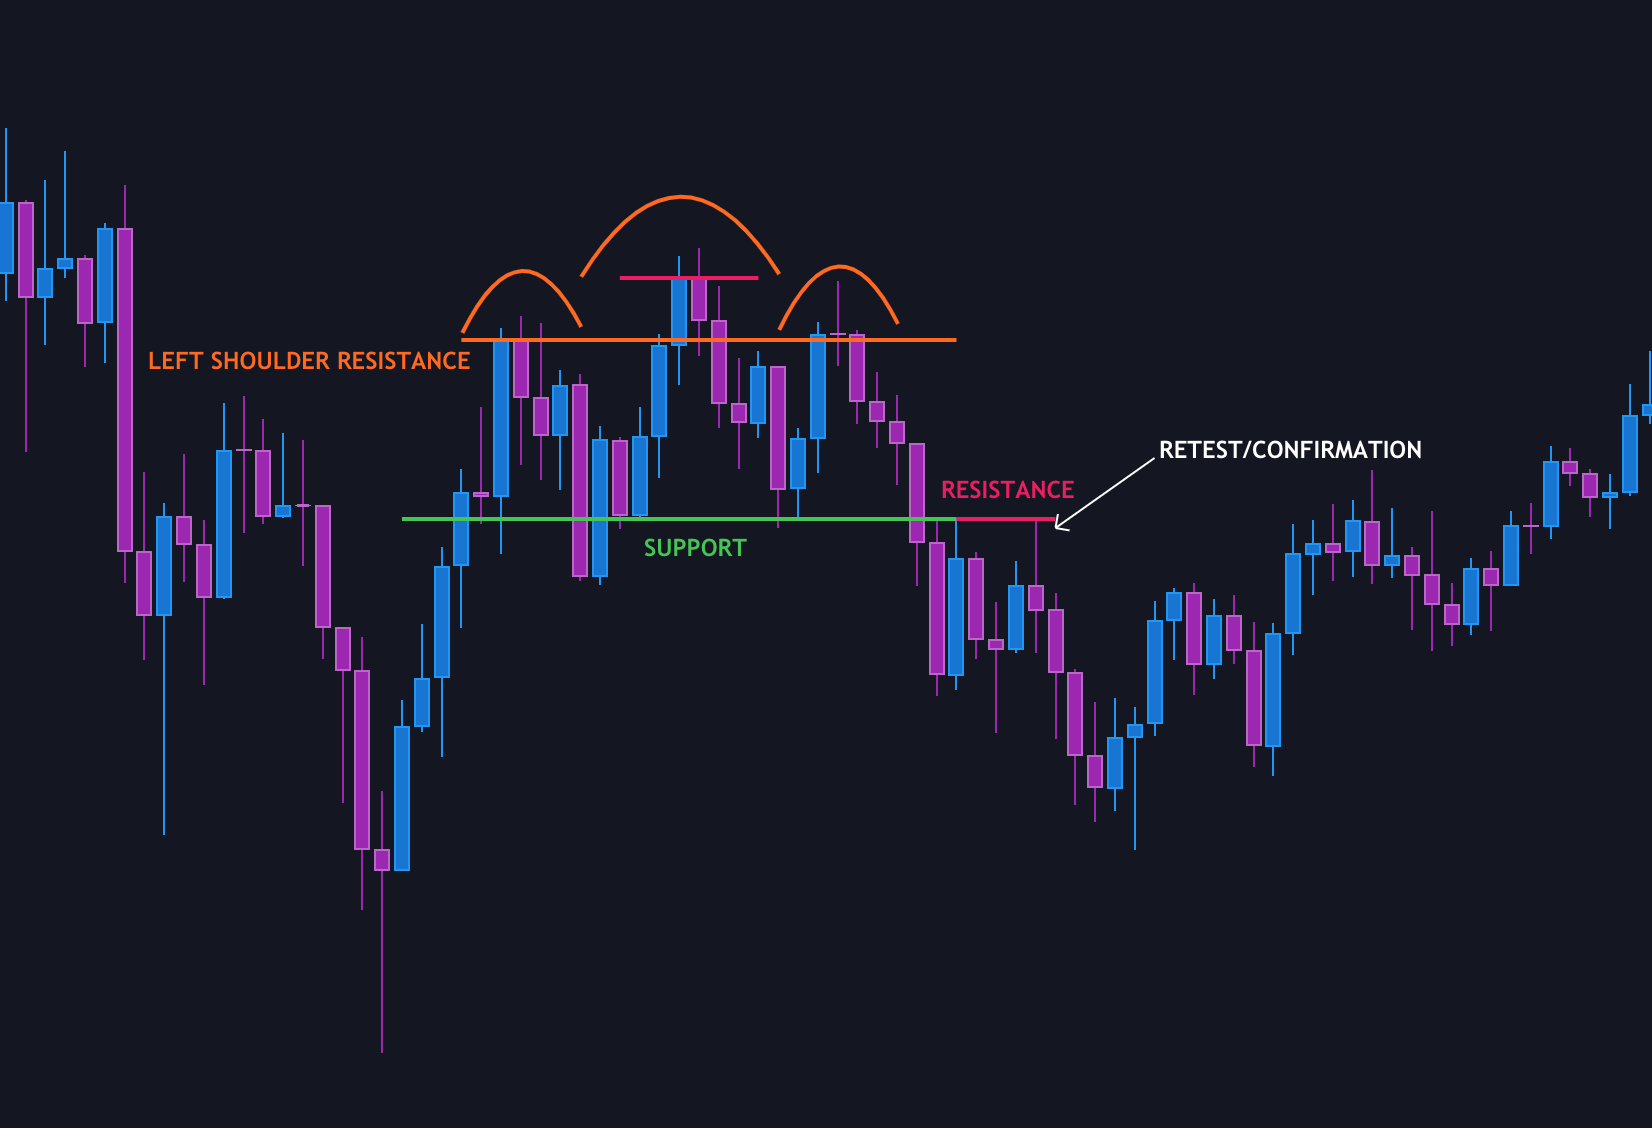
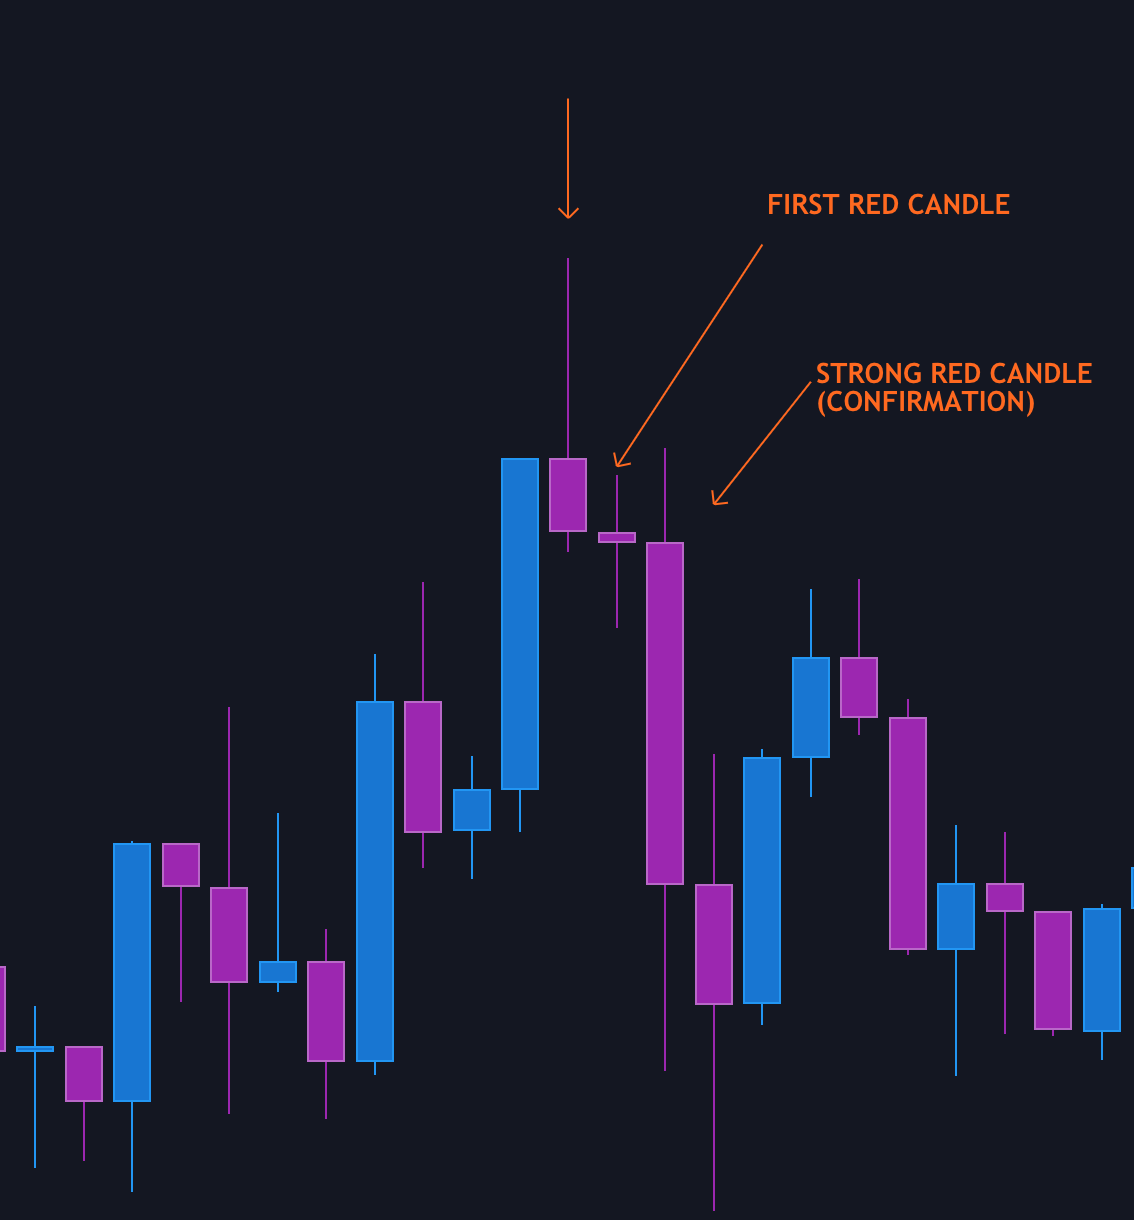
1.2.a. Shoulder Head Shoulder (Bearish) (updated on 07/09/21)

Exactly like the Inverse Shoulder Head Shoulder, this pattern is following by a strong movement. As you can imagine, is not a pump but a big DUMP. When the neck is breakdown, price print a big red candle.
1.3. Rising & Falling Wedge
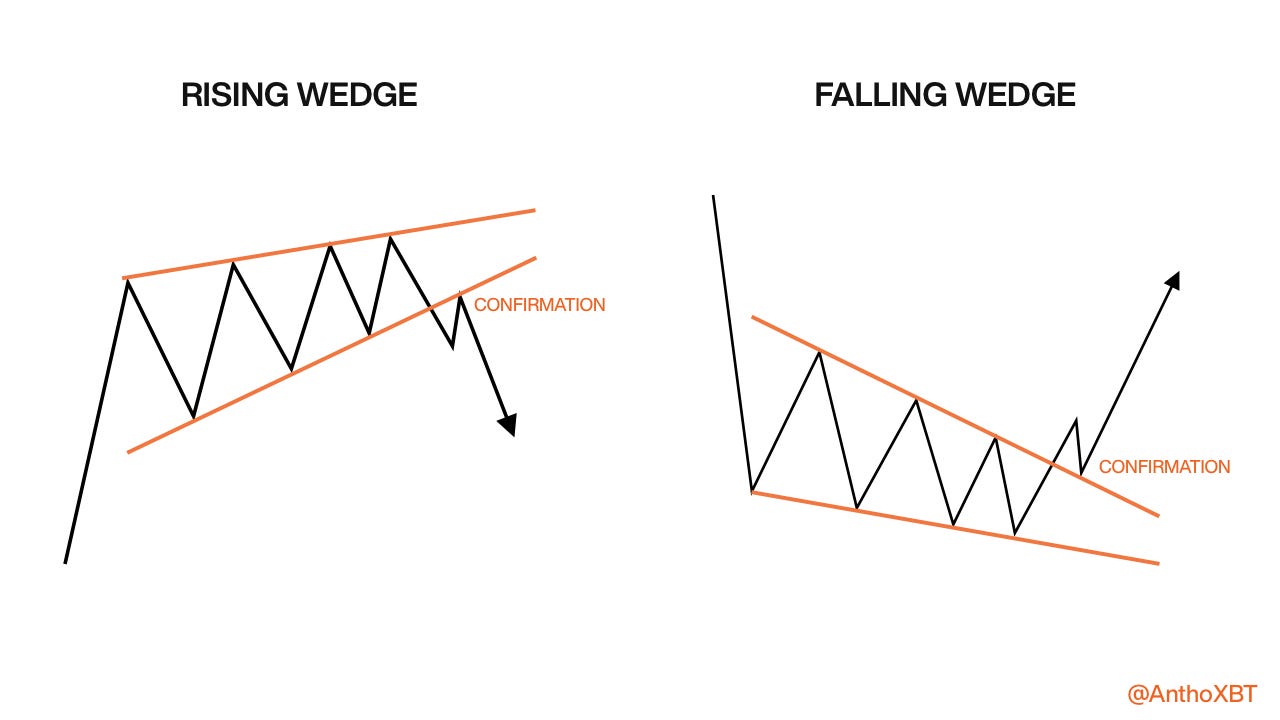
1.3.a. Rising Wedge (Bearish)
A rising wedge starts with a wide trading range between resistance and support, and then narrows as the price rises. At the point where resistance and support are very close, a breakout from below often confirms this pattern.
Like all patterns, a confirmation often follows the breakout. Here, it is a bearish retest where the price tries to re-enter the rising wedge but the previous support acts as resistance.

Here an example of a rising wedge with multiple HL and an ascending diagonal line (resistance) that is approaching the support.
1.3.b. Falling Wedge (Bullish)

This is exactly the same as the rising wedge but inverted. When support approaches resistance, a breakout usually occurs as a result of the price compressing and this time not being held by support but by resistance.
1.4. Bull Flag (Bullish)
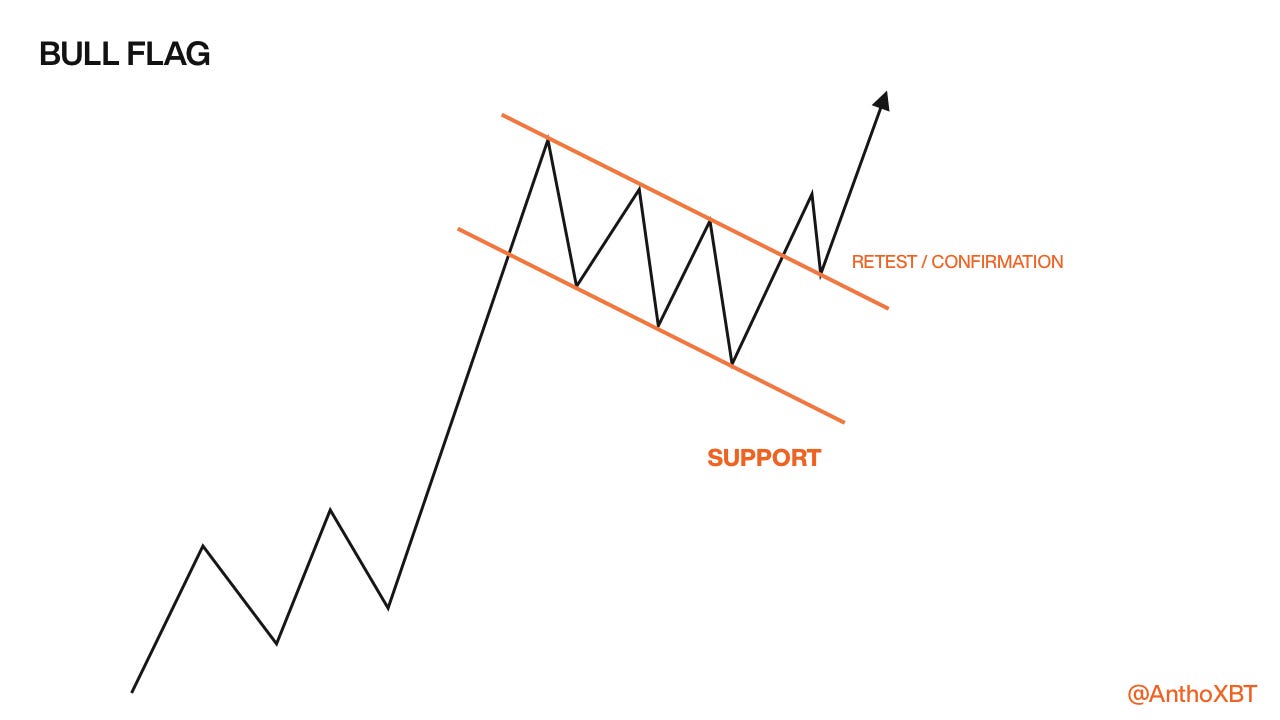
Often a bull flag is the result of a previous pump / uptrend. It’s clearly a downtrend channel with LH and LL. This pattern is easy to see and easy to play. Wait for a breakout and buy on the retest.

As you can see on the example above, it’s a simple and clear downtrend channel. Most of the time, breakout are very good.
1.5. Pennant

1.5.a. Bullish Pennant
Like bull flags, bullish pennants are the result of a pump or an uptrend. It is a big triangle but unlike a rising wedge, there is no side (support or resistance) that has a definitive slope or bullish bias. It is not an easy pattern as there is a higher probability of a breakout in the opposite direction.

As you can see above, this bullish pennant started to develop after an uptrend. A succession of LH and HL finally resulted in a major breakout as the price reached the end of the triangle.
1.5.b. Bearish Pennant
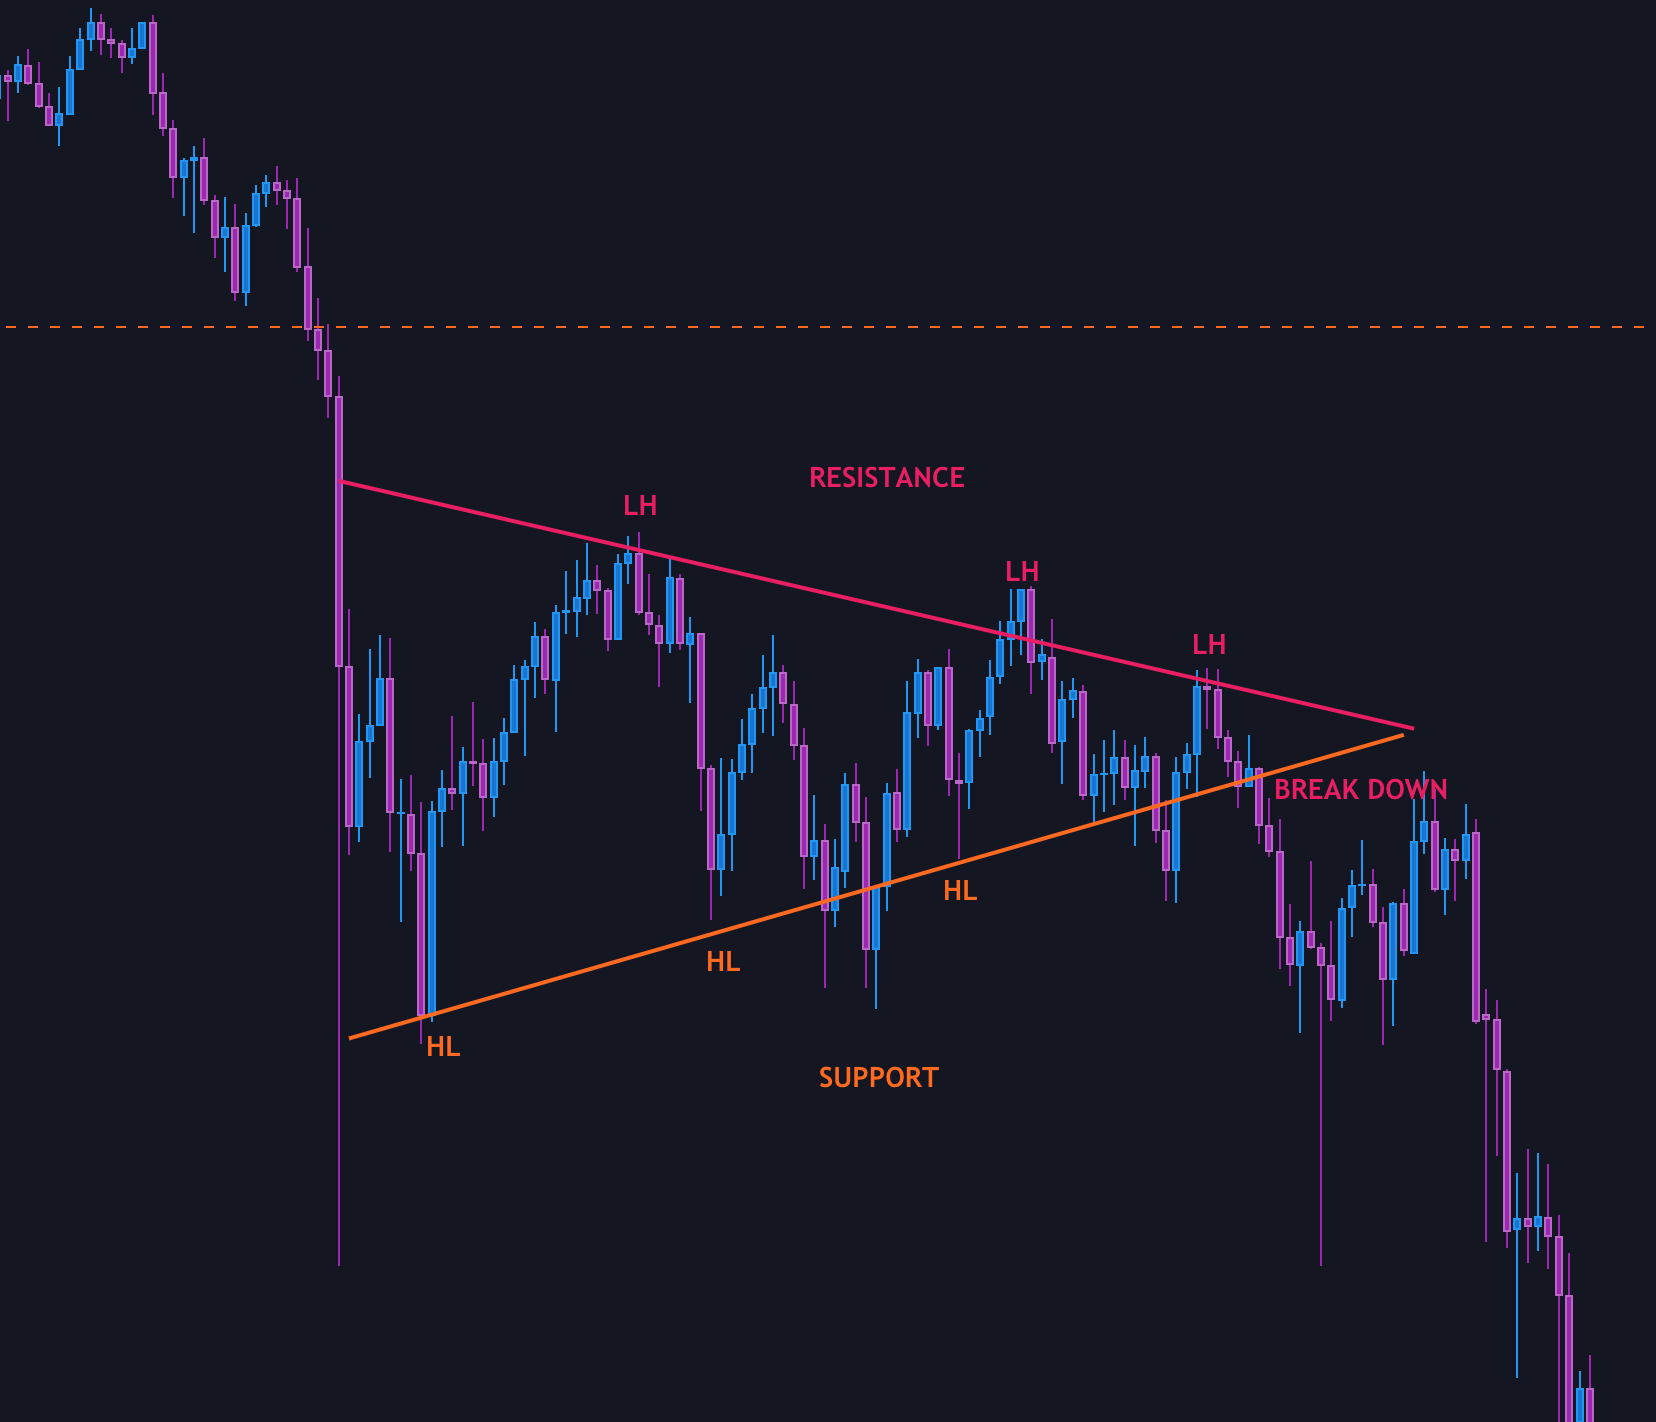
A bearish pennant is EXACTLY the same as a bullish pennant, the only difference is where it comes from. If it comes from a dump / downtrend (see above), it is a bearish pennant. Otherwise is a bullish one.
1.6. Inverted Hammer & Shooting Star
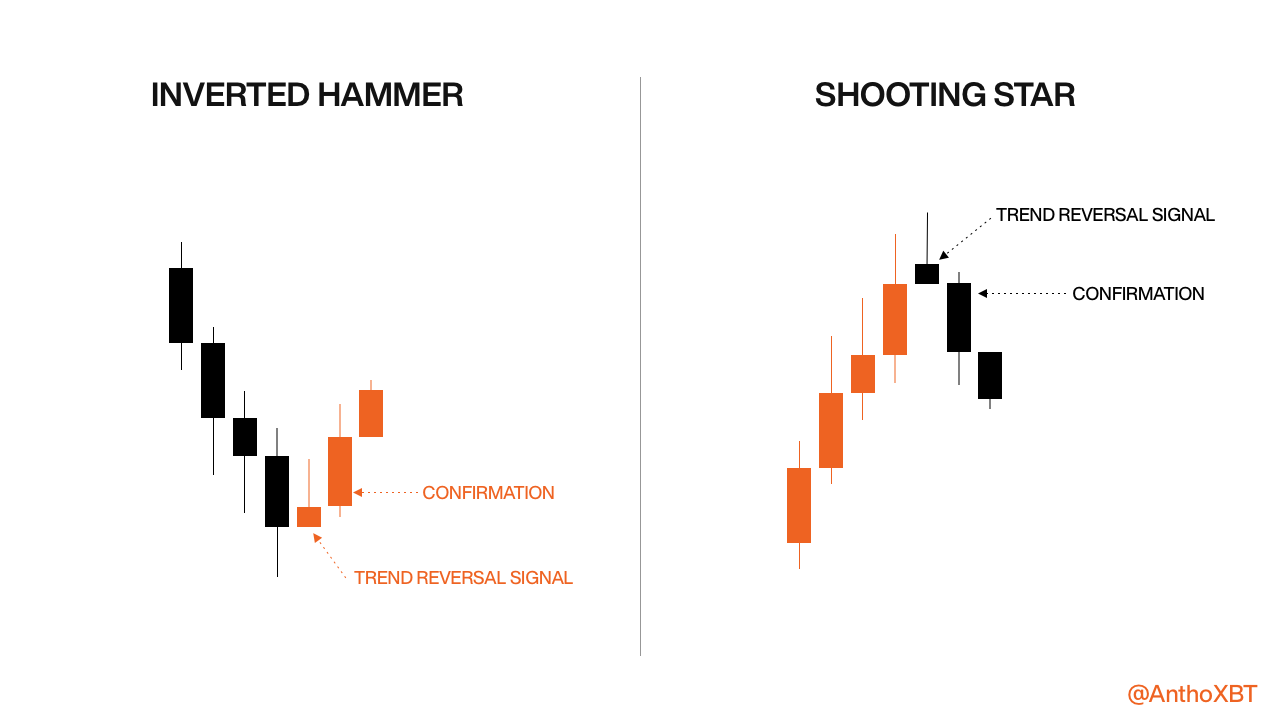
1.6.a. Inverted Hammer (Bullish)
These patterns are reversal figures. They announce a potential trend reversal and are confirmed by the following candles. An inverted hammer has a small or no wick and a small green body. The pattern is not only the hammer by himself, it consists of two or three candles, mainly from the next one which must show a strong buy (big candle)

In this example, you can see a big red candle followed by a hammer (small body and no or small red wick). Then, there was a big green candle confirm the trend reversal.
1.6.b. Shooting Star (Bearish)
It's the same thing as the inverted hammer but in top of trend. First candle is a big green one, then the shooting star candle shows a big red wick and small body and theses candles are followed by a big red one.
1.7. Accumulation Cylinder (updated on 07/09/21)

This pattern is usually formed on large time frames. It is a channel in the shape of a cylinder and therefore widens in time. After 7 consecutive waves in the cylinder, the eighth wave often offers a breakout and the price becomes parabolic.
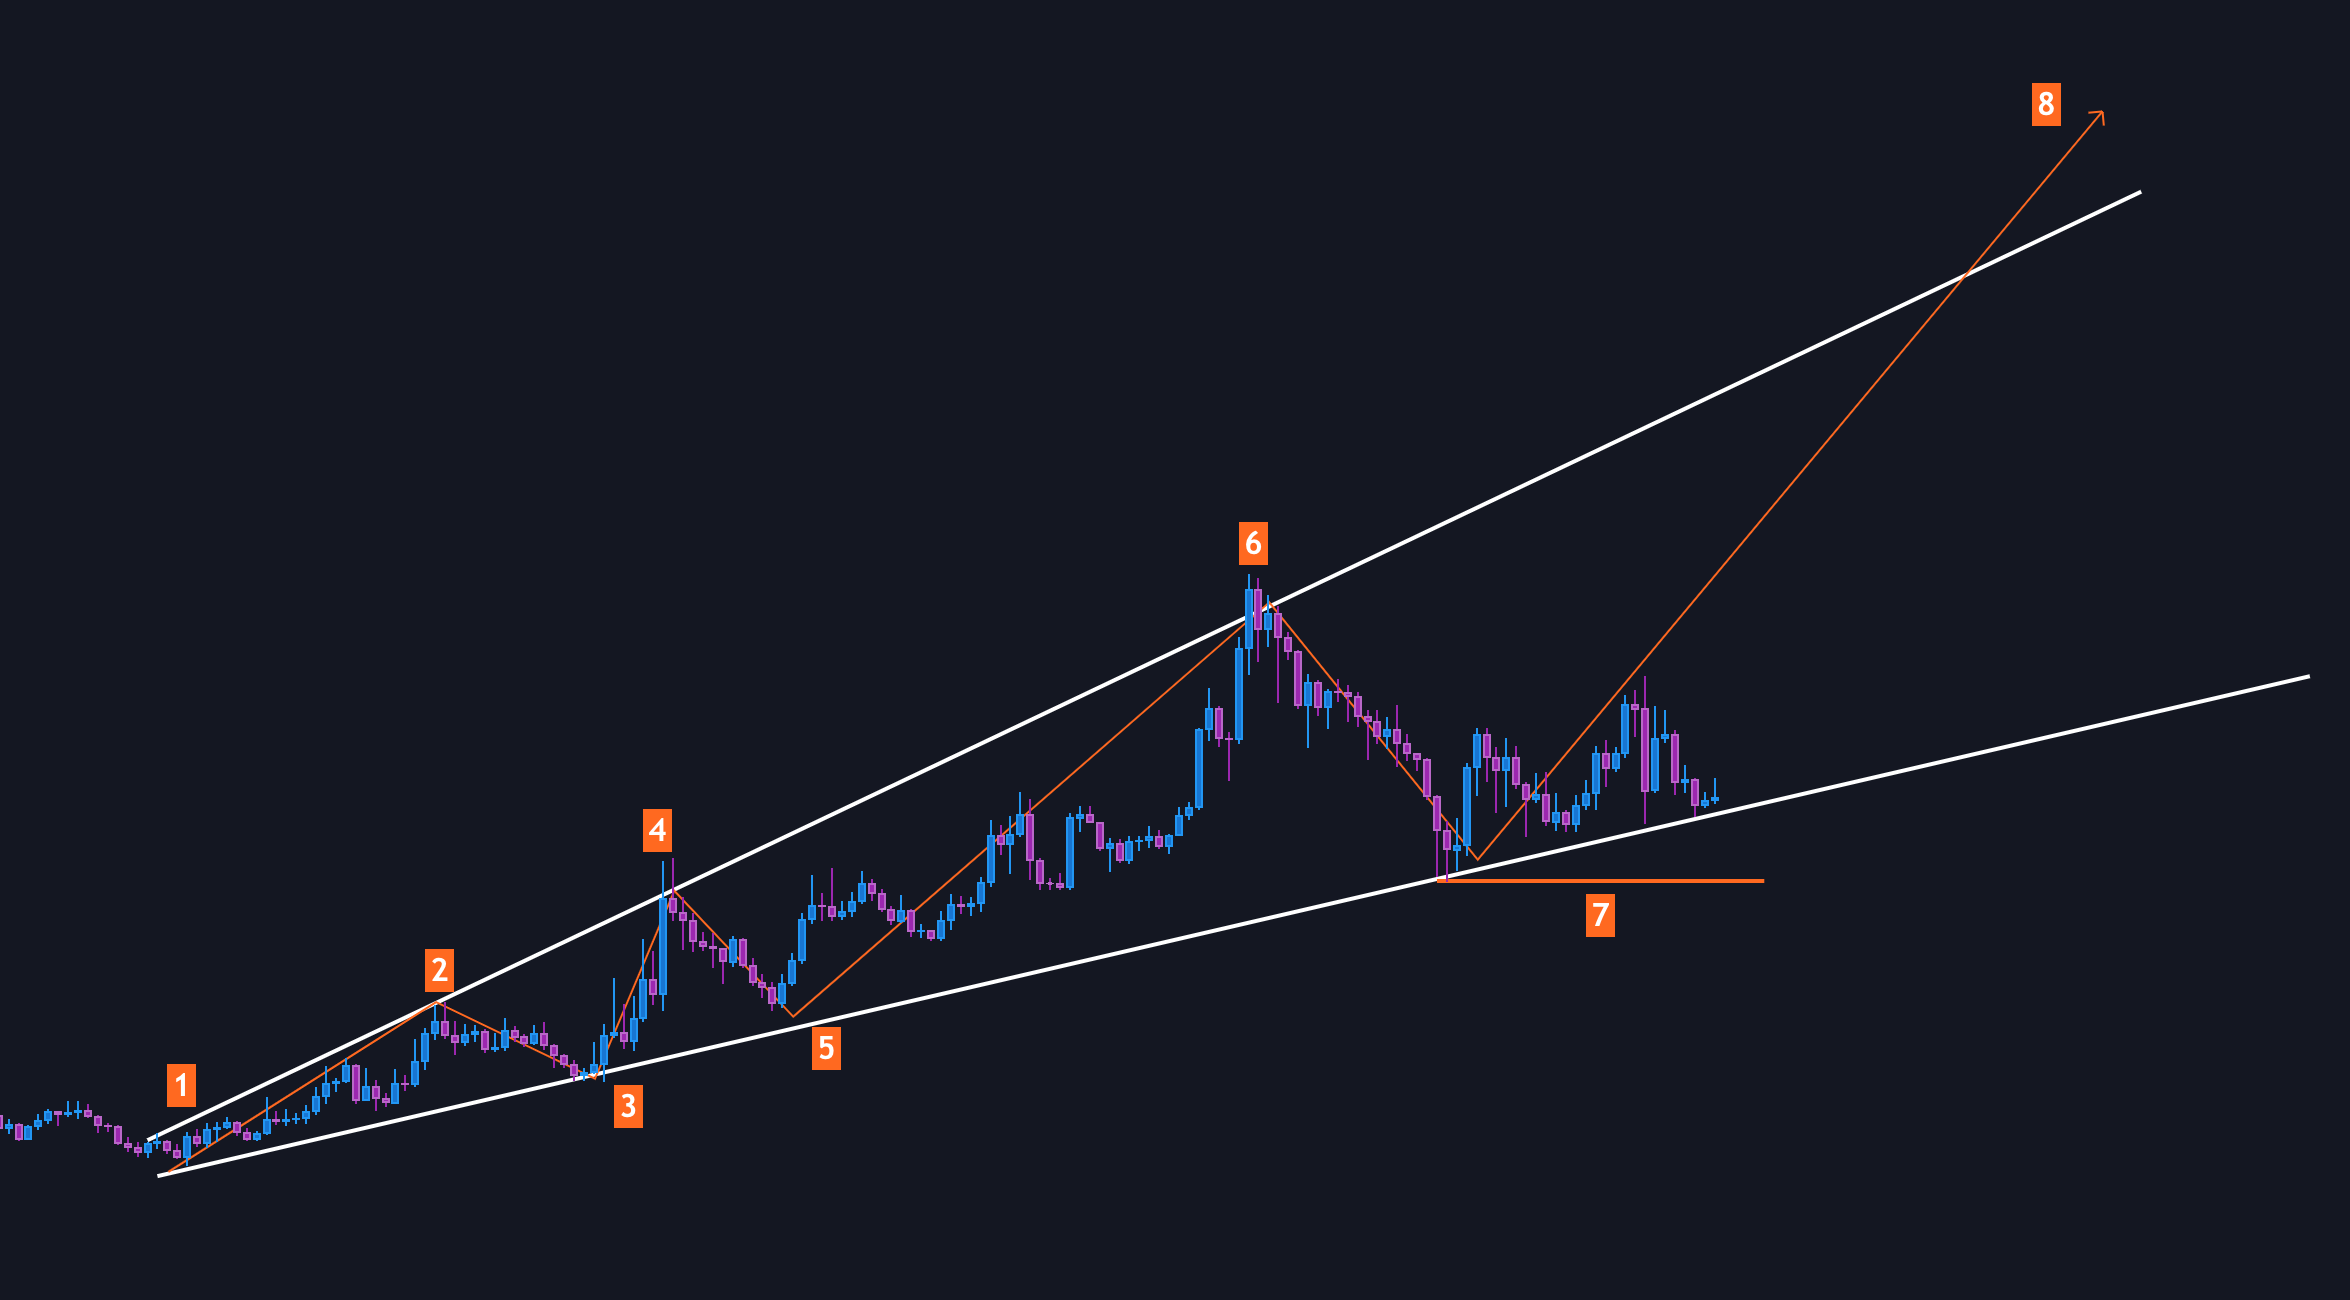
Here, on the LINK/BTC weekly chart, we can see a clear accumulation cylinder good support forming at the cylinder bottom (wave 7). Tt’ll take time to see how the eighth wave will play out but it looks like it will start to happen soon
2. Indicators
Note: To detect divergences with indicators, I strongly recommend using the "line" display of your chart.
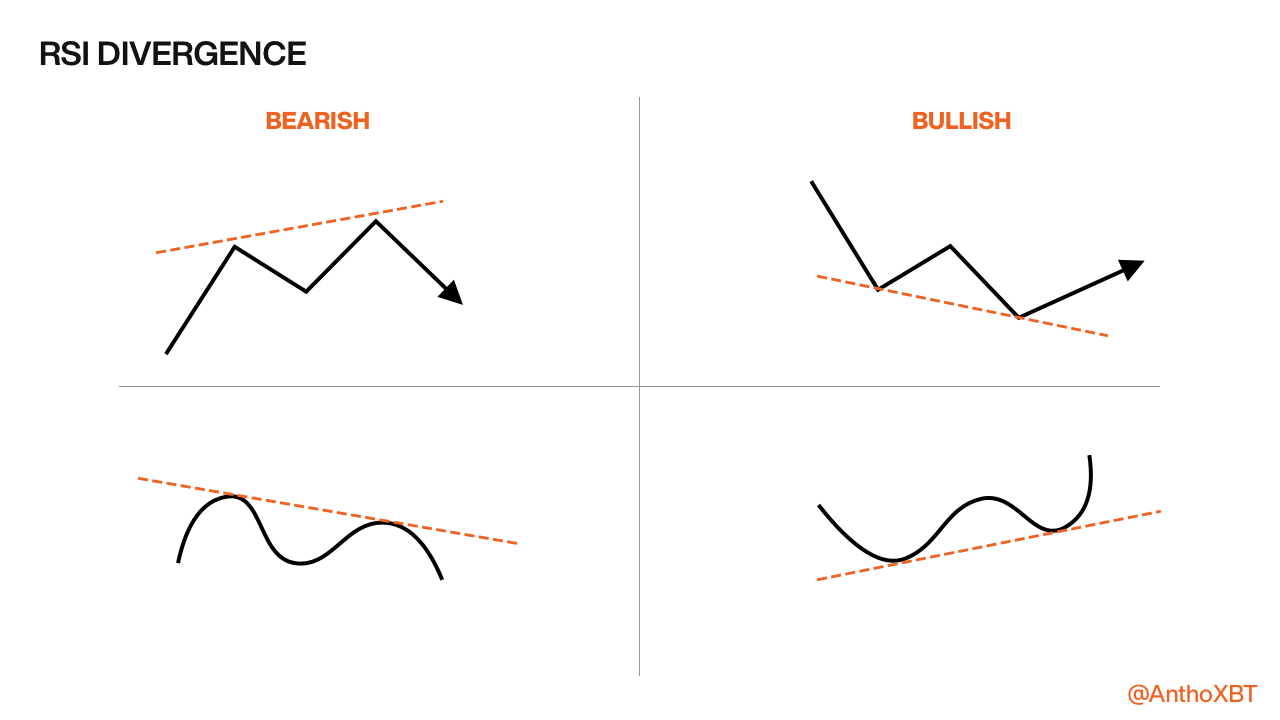
2.1. RSI Divergence
The divergences with the RSI are probably the indicators I use the most. Most of the time, they play perfectly well and help to prepare for an early position without being risky.
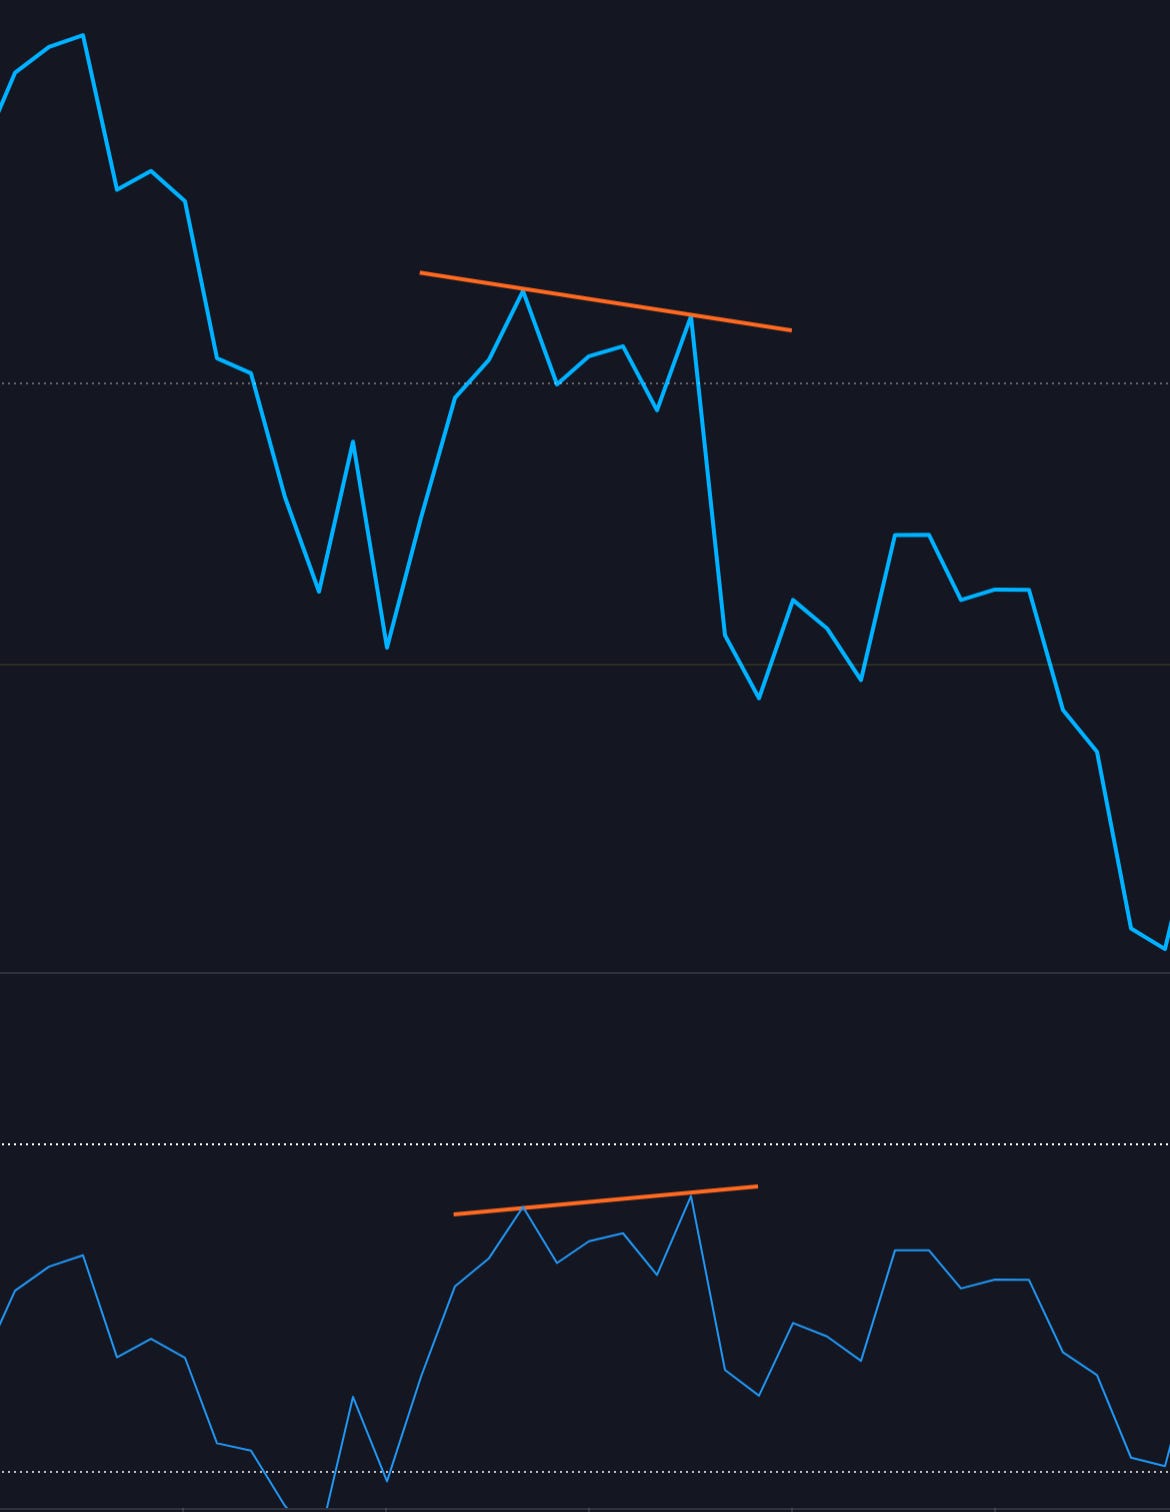
2.1.a. Bearish Divergence
This happens when the price chart makes HH while the indicator (here, the RSI) makes LH.

As you can see on this Bitcoin’s chart, price fell after a series of HH on Bitcoin while the RSI was doing HL.
2.1.b. Bullish Divergence
This happens when the price chart makes LL while the indicator (here, the RSI) makes HL.
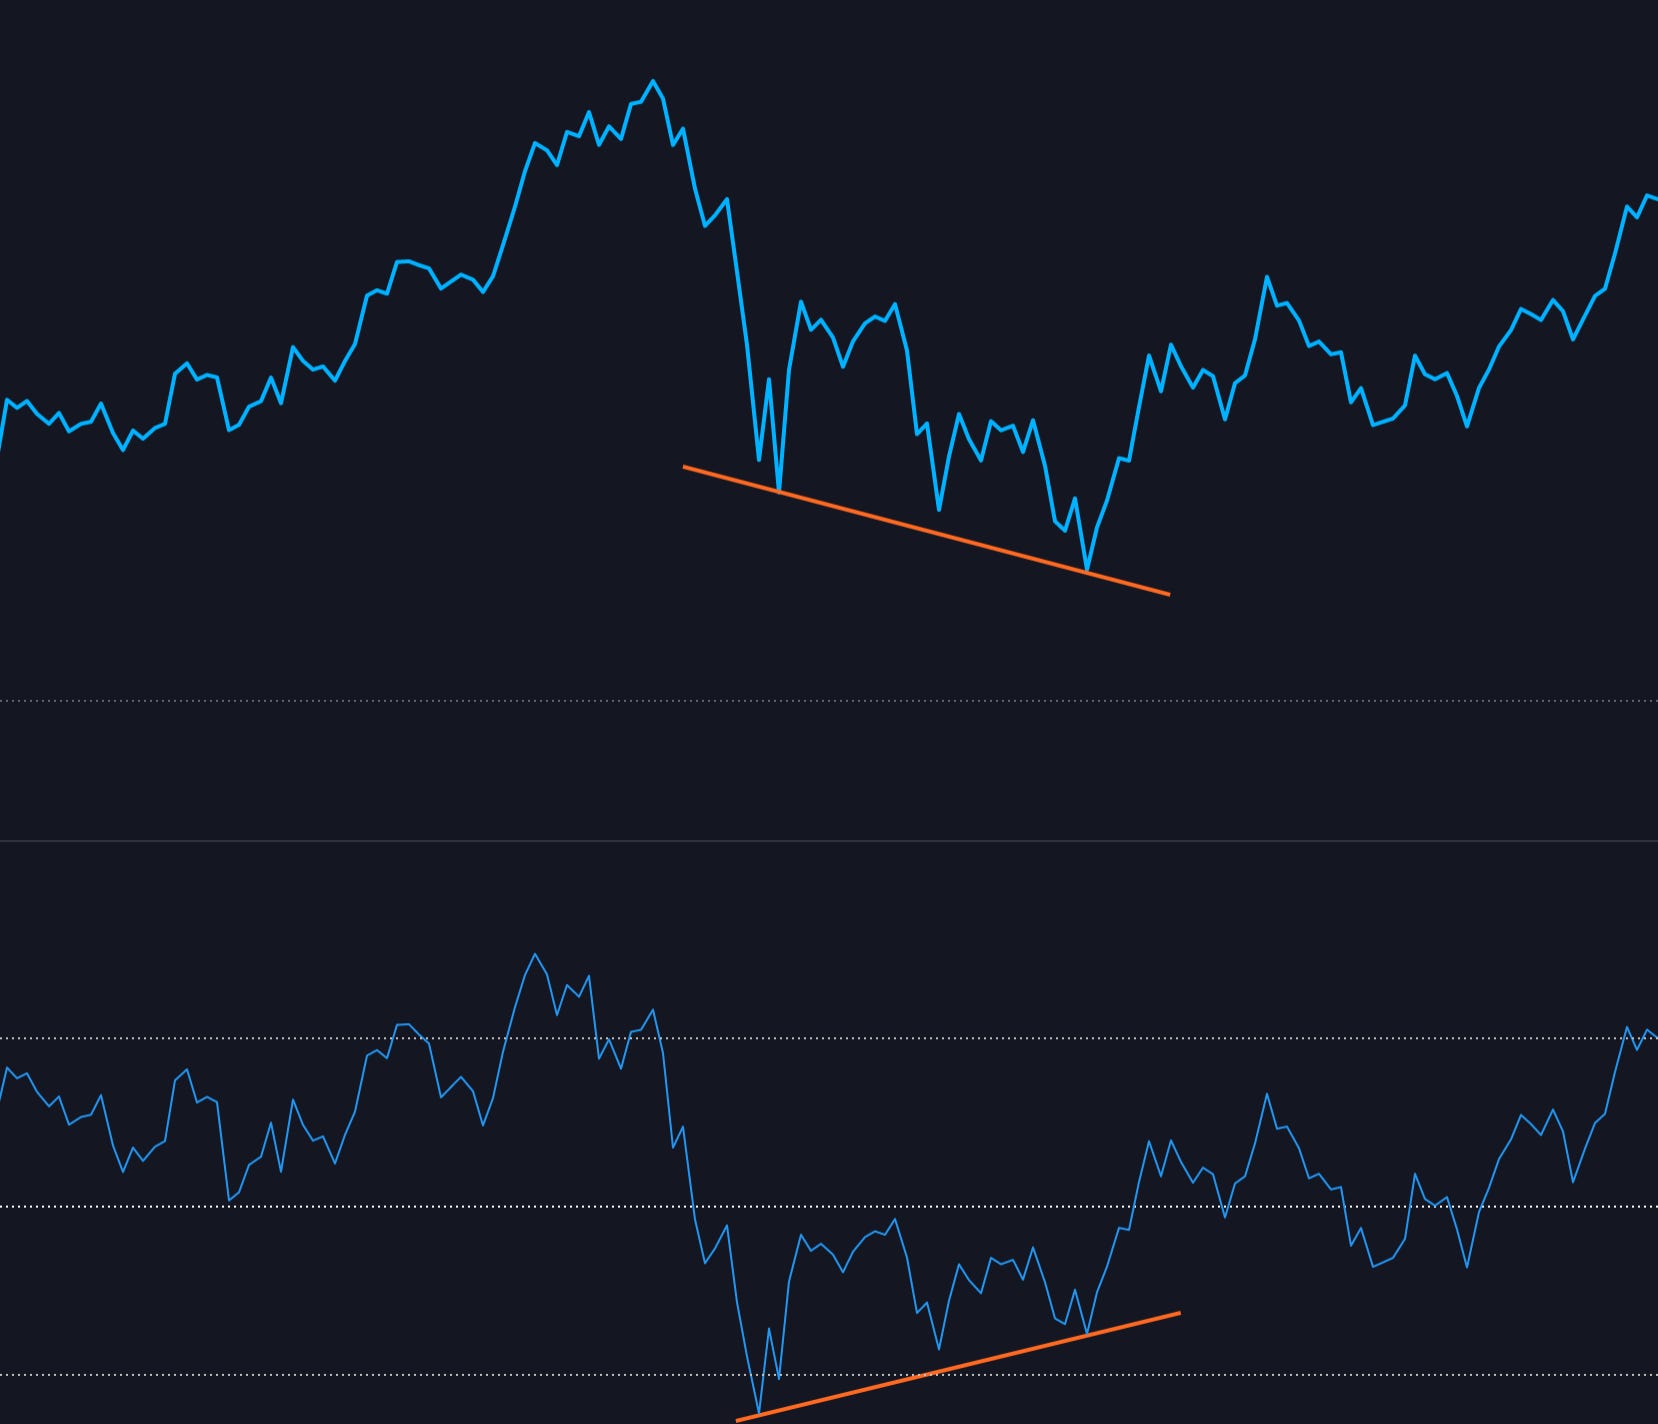
This bullish divergence started to develop just after the bearish divergence I mentioned above. After three tests of support and three LL, the price finally bounced back strongly to resume its uptrend.
2.2. Hidden RSI Divergence

2.2.a. Hidden Bearish Divergence
This happens when the price chart makes LH while the indicator (here, the RSI) makes HH.
As you can see on this Bitcoin’s chart, price fell after a series of HL on Bitcoin while the RSI was doing HH.
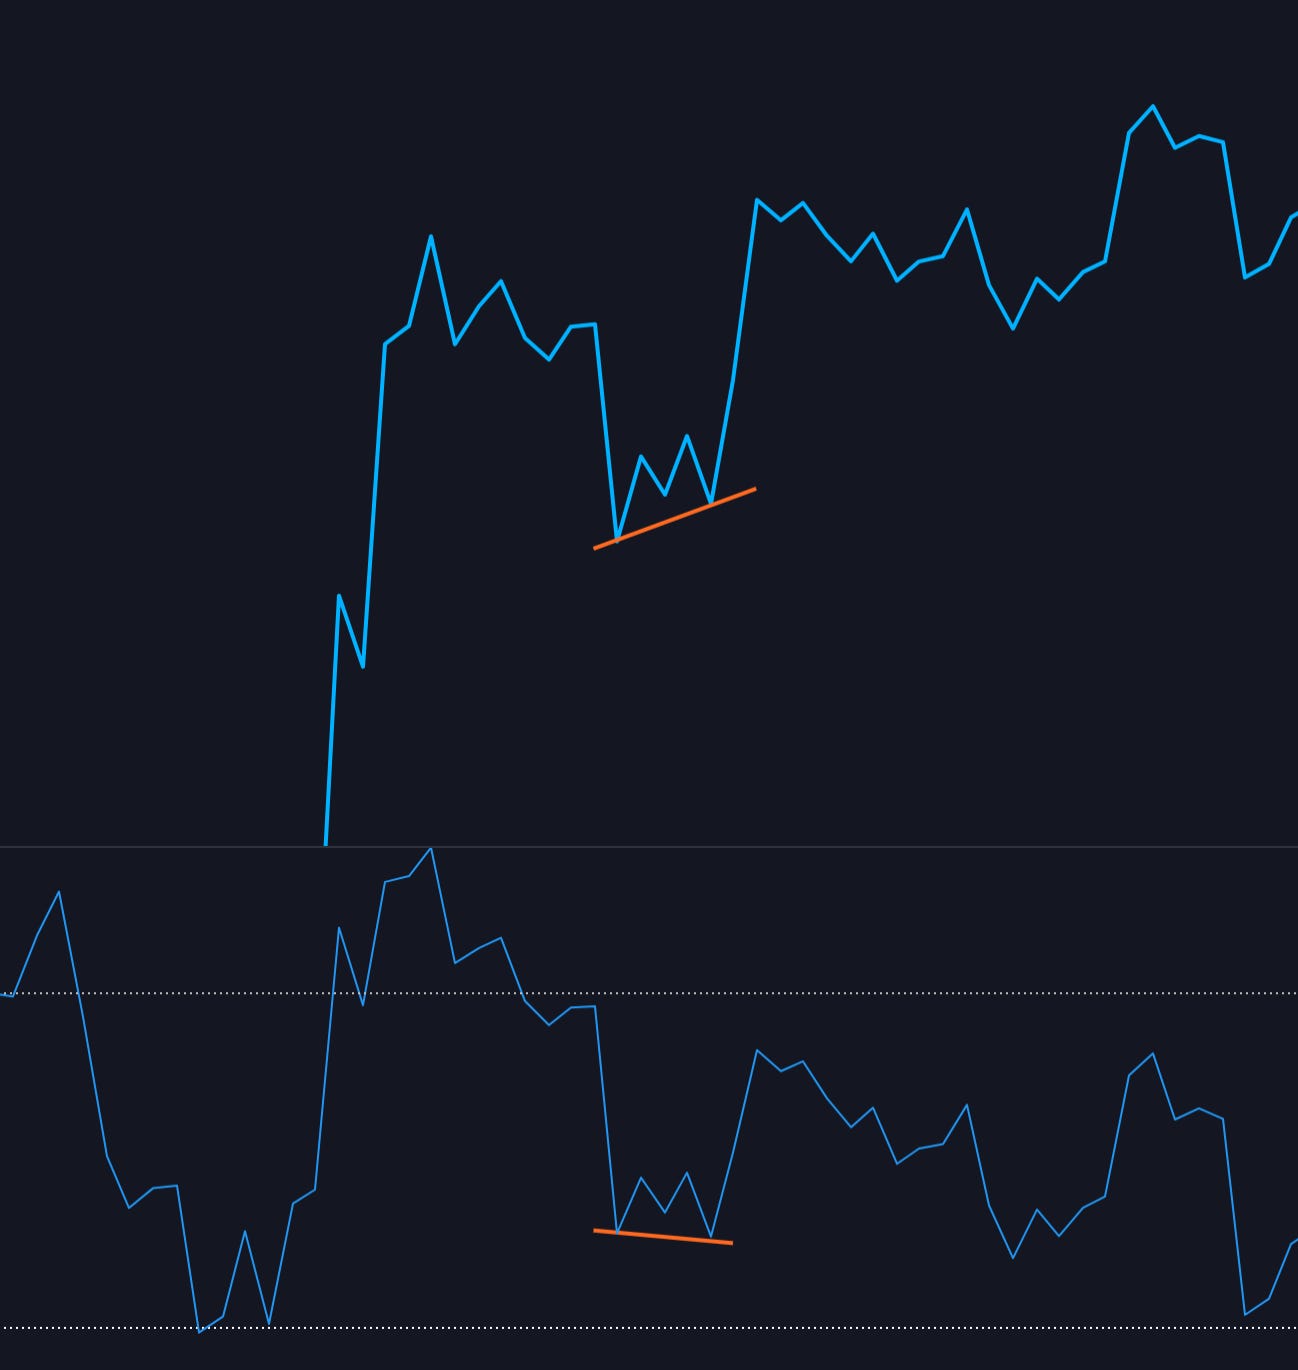
2.2.b. Hidden Bullish Divergence
This happens when the price chart makes HL while the indicator (here, the RSI) makes LL.
More education contents coming soon… Stay tuned and don’t forget to subscribe for FREE!
Do not hesitate to ask your questions in the comments!
Awesome! Thanks you 😀
I learn many thing for you! Thanks for this post sir :)