

Bitcoin Technical Analysis Update - Week 44
Bitcoin Technical Analysis Update - Week 44
Bitcoin made its highest monthly close in its history - the whole market is moving healthily and altcoins are heating up!


Registrations are open! As you know, Gaurav and I opened a Paid Discord Group for only $23 per month. We provide future and spot trading call but also portfolio management to rotate your money in the best possible way! JOIN US NOW:
Summary
Previous Analysis
Fibonacci Levels
Historic! Highest Monthly Close For Bitcoin
Fear & Greed Index
Bitcoin Dominance (BTC.D)
Weekly Plan
6.1 First scenario
6.2 Second scenarioOverall
1. Previous Analysis

In my last Bitcoin technical analysis, I talked about a potential pullback (red scenario). In fact, we got a correction a little bit lower than I expected around $58,300. This pullback has also pushed down the dominance (BTC.D) that allow altcoins to pump.
Last week was very important because we had the monthly close, and this one is very very bullish. Let me explain why in this new analysis.
2. Fibonacci Levels
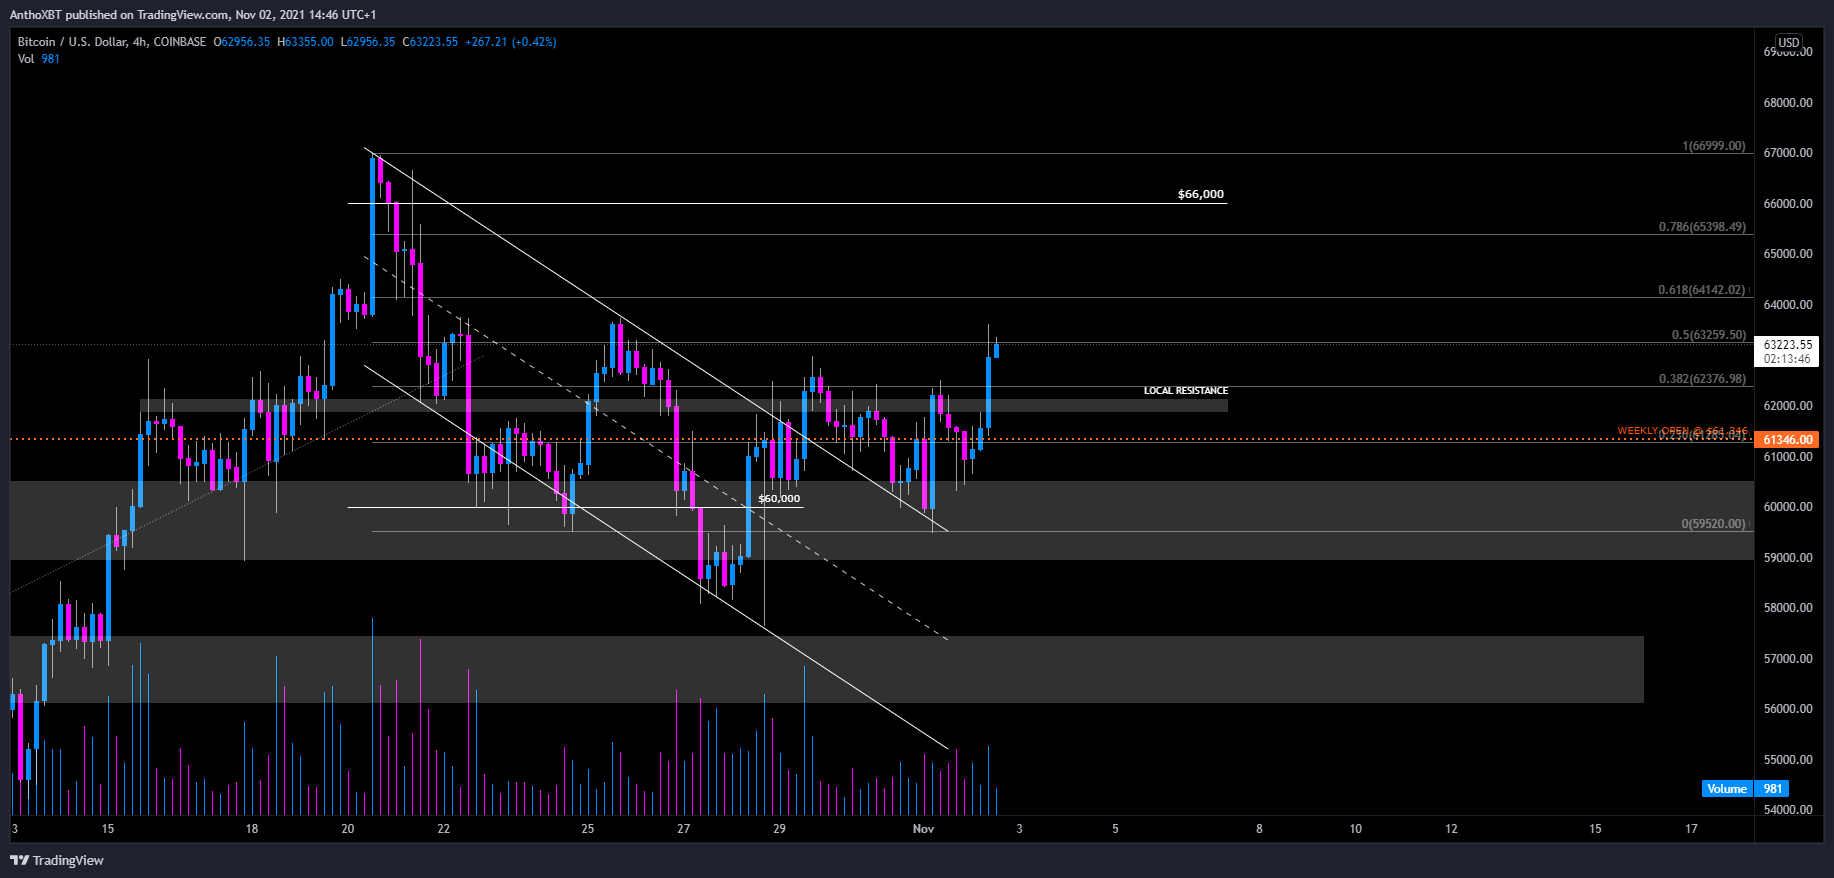
Here, the same Fibonacci retracement that I talked in the last analysis. After a clean breakout of its downtrend channel followed by a successful retest, Bitcoin break (this morning) the 0.382 fib at $62,475. I think, we should see some ranging between theses fibs levels to allow alts for one more leg up before a strong bounce toward a new ATH.
3. Historic! Highest Monthly Close For Bitcoin
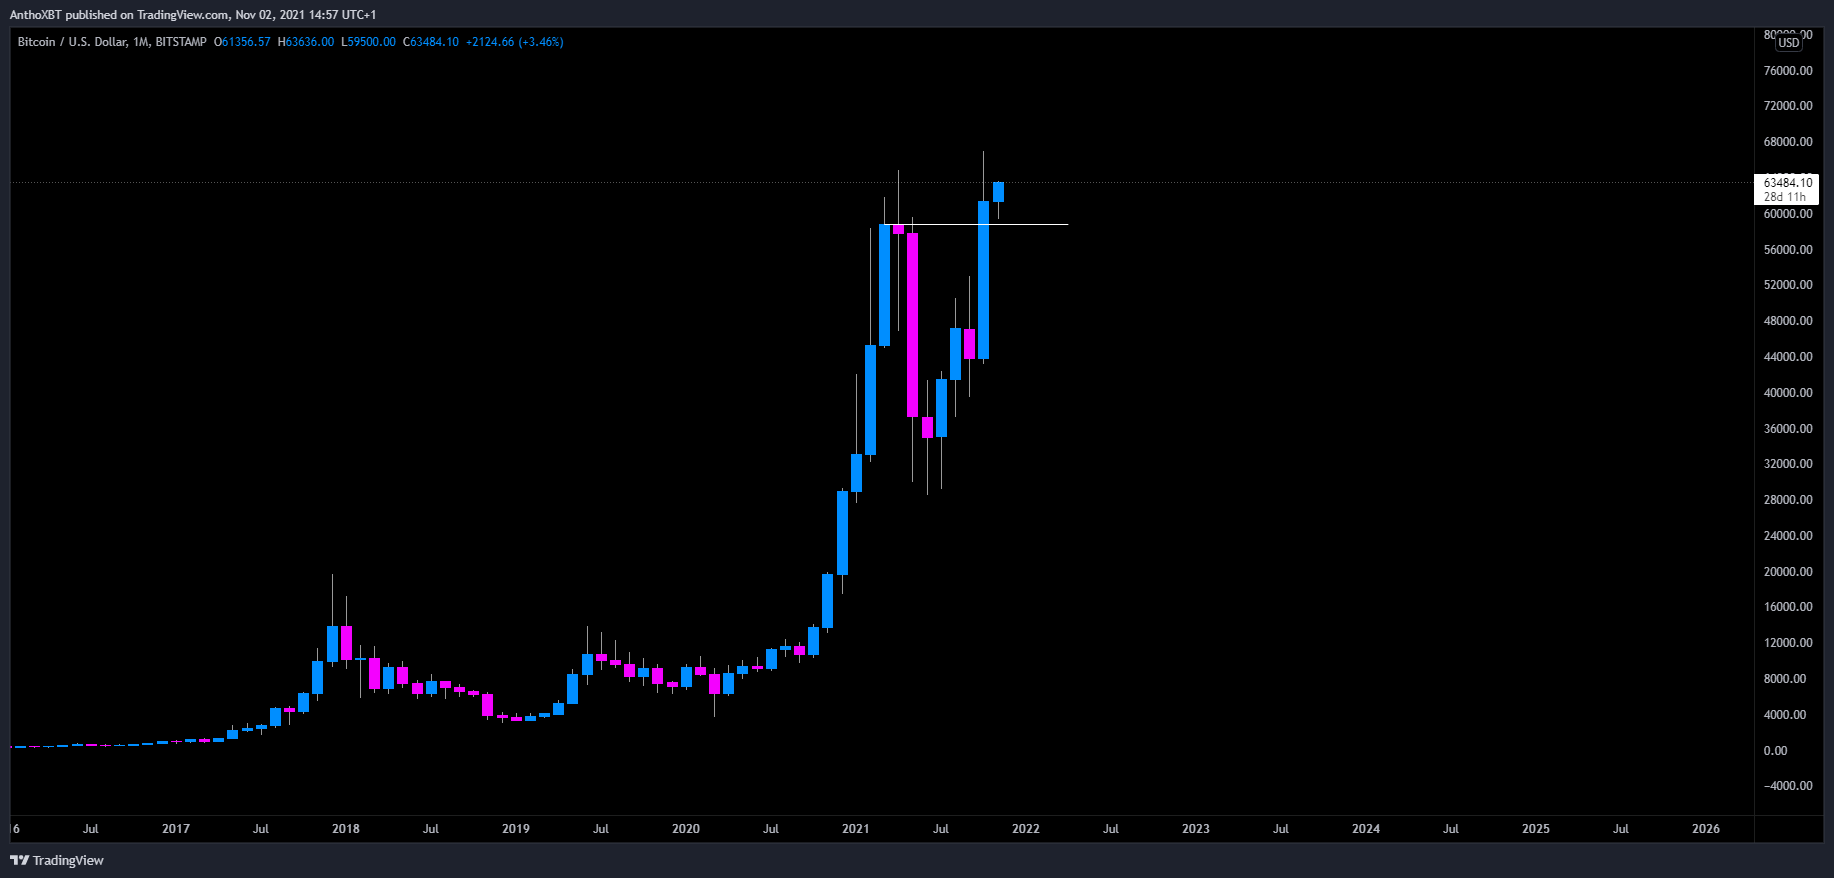
Crazy is’n it? When you remember where Bitcoin was few weeks ago, this monthly close shows you how bullish crypto market is right now!
The weekly close was not bat as well, in fact, we can clearly see the R/S flip from mid-year resistance:
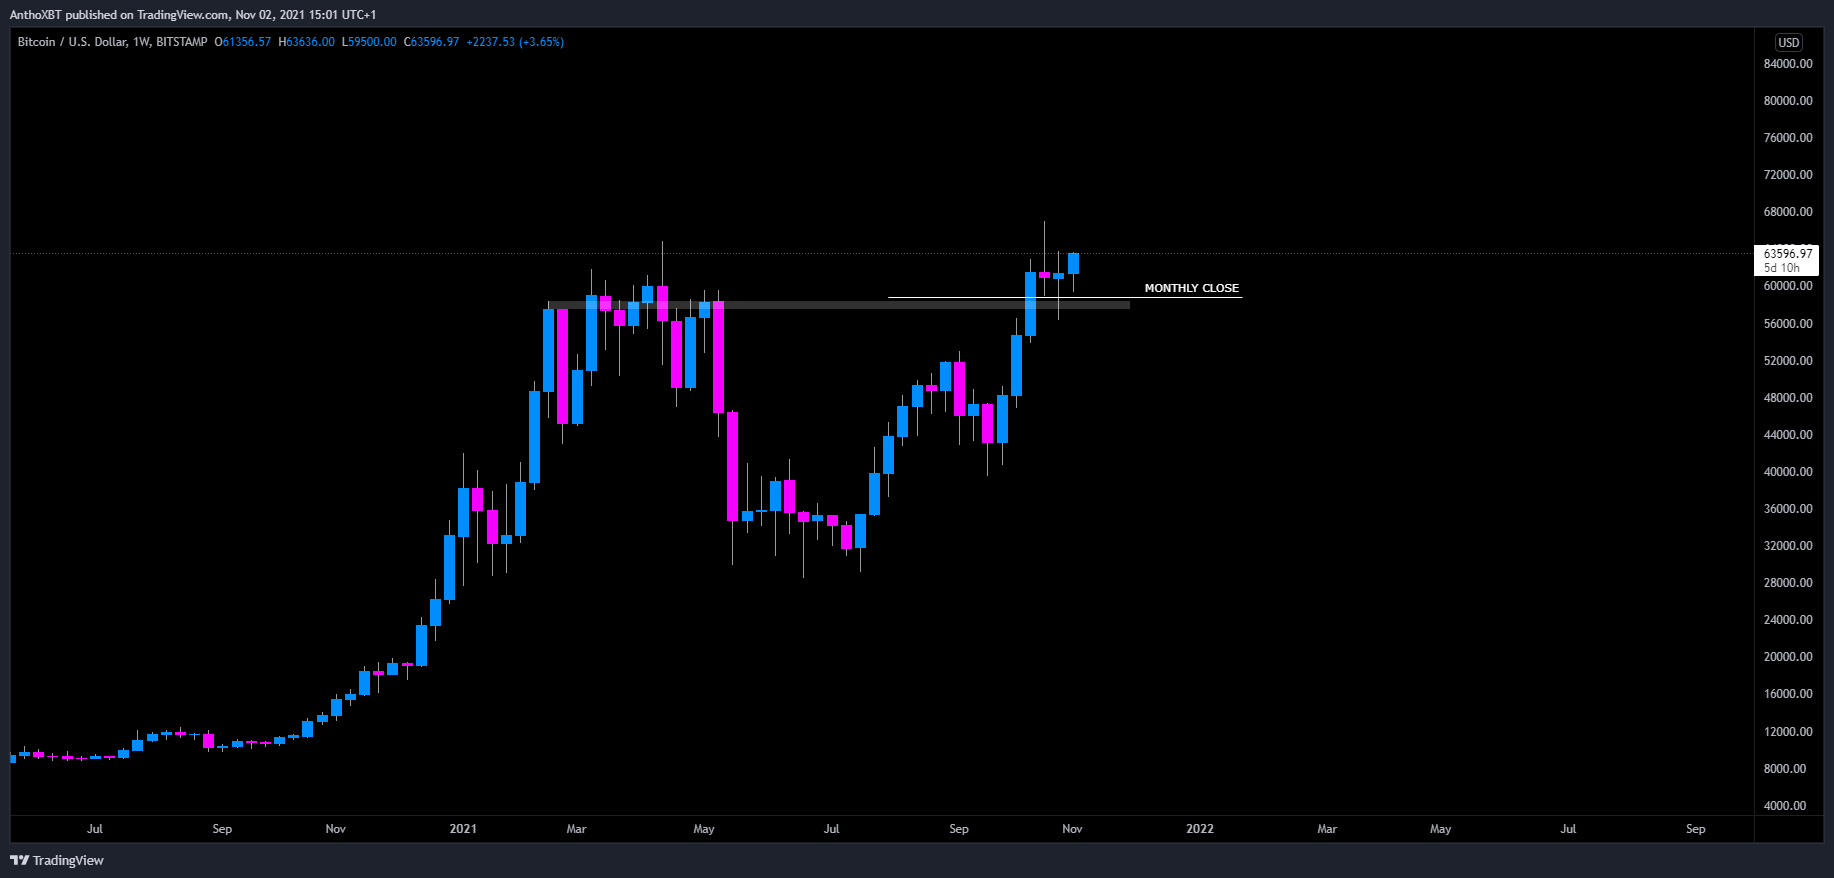
To be honest, I didn’t see Bitcoin bullish like this for a while and for me this current chart is more bullish than the one after the bounce from the low.
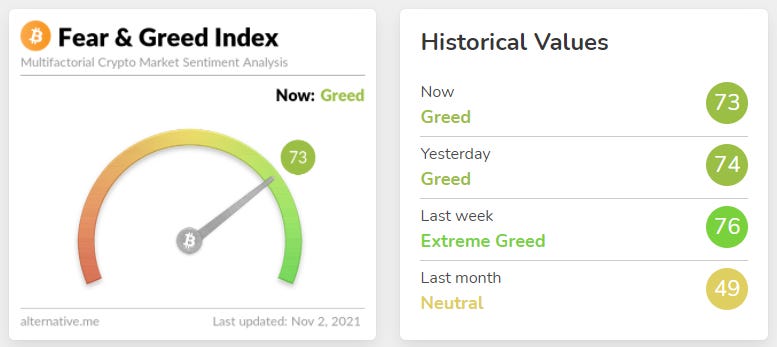
4. Fear & Green Index

I (fucking) love to see this. Bitcoin looks very bullish and the Fear & Greed Index is not even in “Extreme Greed”! Imo, this current price action is much stronger than it was in the middle of the year when Bitcoin was on the same levels.
5. Bitcoin Dominance (BTC.D)

That’s how I see the next days for the Bitcoin’s dominance. I think we should have a new small dump to retest the next support that will allow alts to get a new window to pump. Then, the King should takes its place again and reach a new ATH while leaving altcoin behind him before the real real alt season by the end of the year.
6. Weekly Plan
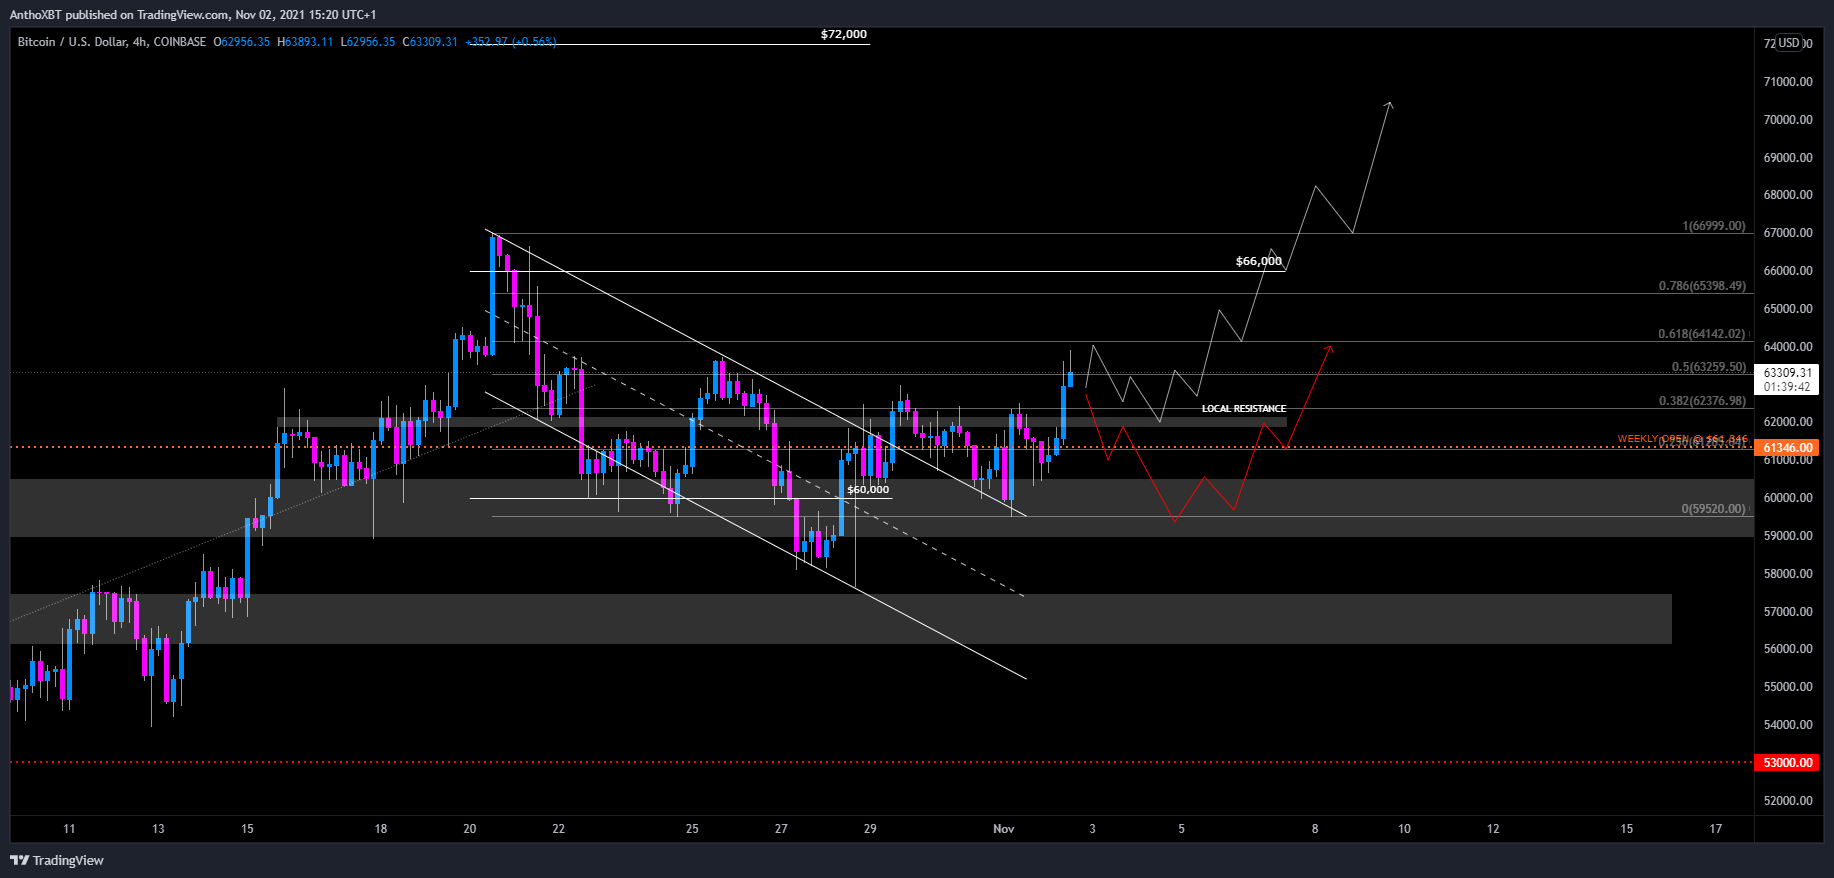
6.1. First scenario:
Bitcoin is ranging between fibs with a potential retest of the $62,000 area
Then, break $64,000 resistance with continuation toward $66,000
Strong move upward to reach a new ATH around $70,000
6.2. Second scenario:
$62,000 area failed to hold as support and Bitcoin goes back to $60,000
I’m expecting this level to hold and a bounce from here
Then, I’m expecting the the scenario 1 again
Note: As you know, I always share two scenario to be prepared in any case but this time, the scenario 1 has (for me) more than 90% to happen.
7. Overall,
everything is moving well past few weeks on crypto market, Bitcoin is moving upward then, consolidate and allow alts to pump etc… The current price action is very healthy imo and we are preparing for a crazy end of year. Fill your bags.
If you like it, don’t forget to subscribe, share and follow theses account on Twitter: @AnthoXBT & @ApeBaguette