

Bitcoin Technical Analysis Update - Week 43
Bitcoin Technical Analysis Update - Week 43
New Bitcoin ATH followed by a pullback to retest $60,000, what can we expect now?

Summary
Previous Analysis
Fibonacci Levels
Weekly Close: Price Reaction at Bitcoin ATH
Fear & Greed Index
Bitcoin Dominance (BTC.D)
Weekly Plan
6.1 First scenario
6.2 Second scenarioOverall
1. Previous Analysis

In my last Bitcoin technical analysis, I shared this fractal based on the white area. If you follow me on Twitter, you saw how accurate was this prediction. Indeed, Bitcoin reached a new ATH exactly in the same timing above.
In the days that followed, the king corrected to retest $60,000 as support which, by the way, held up very well as the first few hours of this new week offered us a nice pump above $62,000.
2. Fibonacci Levels

This is not the same Fibonacci Retracement as usual, in fact, it’s a local retracement from the last ATH to the last low. While I’m writing theses lines, Bitcoin is breaking out the 0.382 fib ad heading to the 0.5 fib around $63,300, a very important level to flip as support.
3. Weekly Close: Price Reaction at Bitcoin ATH

At first glance, this weekly candle is not the prettiest, I grant you. But when you draw a single line from the highest weekly closing of this mid-year, you realize how important and especially beautiful it is!
Now, look at it on the daily time frame:

I see your smile. What do you think about this path? Looks good, isn’t it? This pullback was an healthy one, and this is exactly what we need to build a strong uptrend toward new high.
4. Fear & Green Index

The Fear & Greed Index is back in “Greed”. It’s always good to see the Fear & Greed Index cooling off. We have now more room to go before any new “pull back” on this indicator.

5. Bitcoin Dominance (BTC.D)
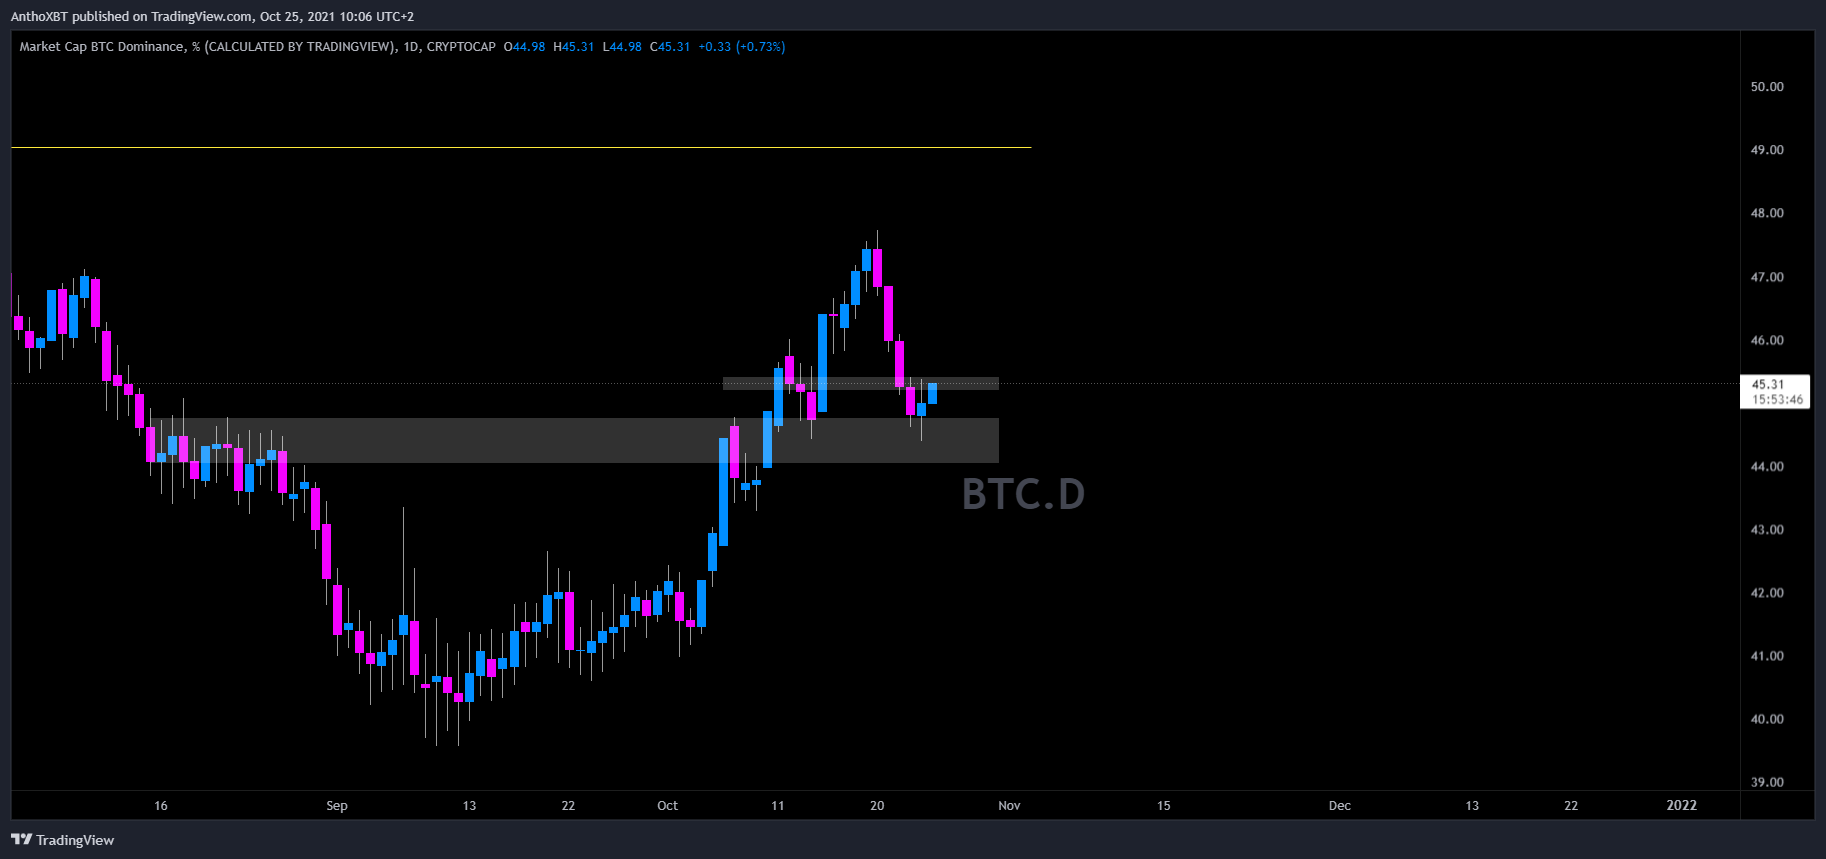
This Bitcoin Dominance chart is looking good tbh. This pullback looks a lot like a support retest before continuing its uptrend. Altcoins may suffer again before the alt season that we are all waiting for. If you’re trading future on alts, please, be very careful and manage your risk.
6. Weekly Plan

6.1. First scenario:
Bitcoin continue to push higher and flip $63,300 as support
Consolidation before $66,000 resistance, then flip it and print a new ATH
I still believe in $70,000+ before any real (big) correction
6.2. Second scenario:
$63,000 is rejected (maybe 1-3 taps)
Bitcoin goes back to retest $60,000 level as support again
If we bounce from this level (again), I’m expecting the scenario 1 again, otherwise, $57,000 is my target area
7. Overall,
how can we be bearish at ATH area? Bitcoin correct from $67,000, but if you zoom out, this pullback seems ridiculous compared to the rise we have had in the last few weeks.
I’m still bullish on Bitcoin and as I said above, I really target $70,000 before any hard sell off. Stay safe!
If you like it, don’t forget to subscribe, share and follow theses account on Twitter: @AnthoXBT & @ApeBaguette