

Bitcoin Technical Analysis Update - Week 42
Bitcoin Technical Analysis Update - Week 42
Historic! Bitcoin made the highest weekly close in its history. That's it. **drop the mic**

Summary
Previous Analysis
Fibonacci Levels
Highest Weekly Close in Bitcoin History!
Fractal to ATH
Fear & Greed Index
Bitcoin Dominance (BTC.D)
Weekly Plan
7.1 First scenario
7.2 Second scenarioOverall
1. Previous Analysis
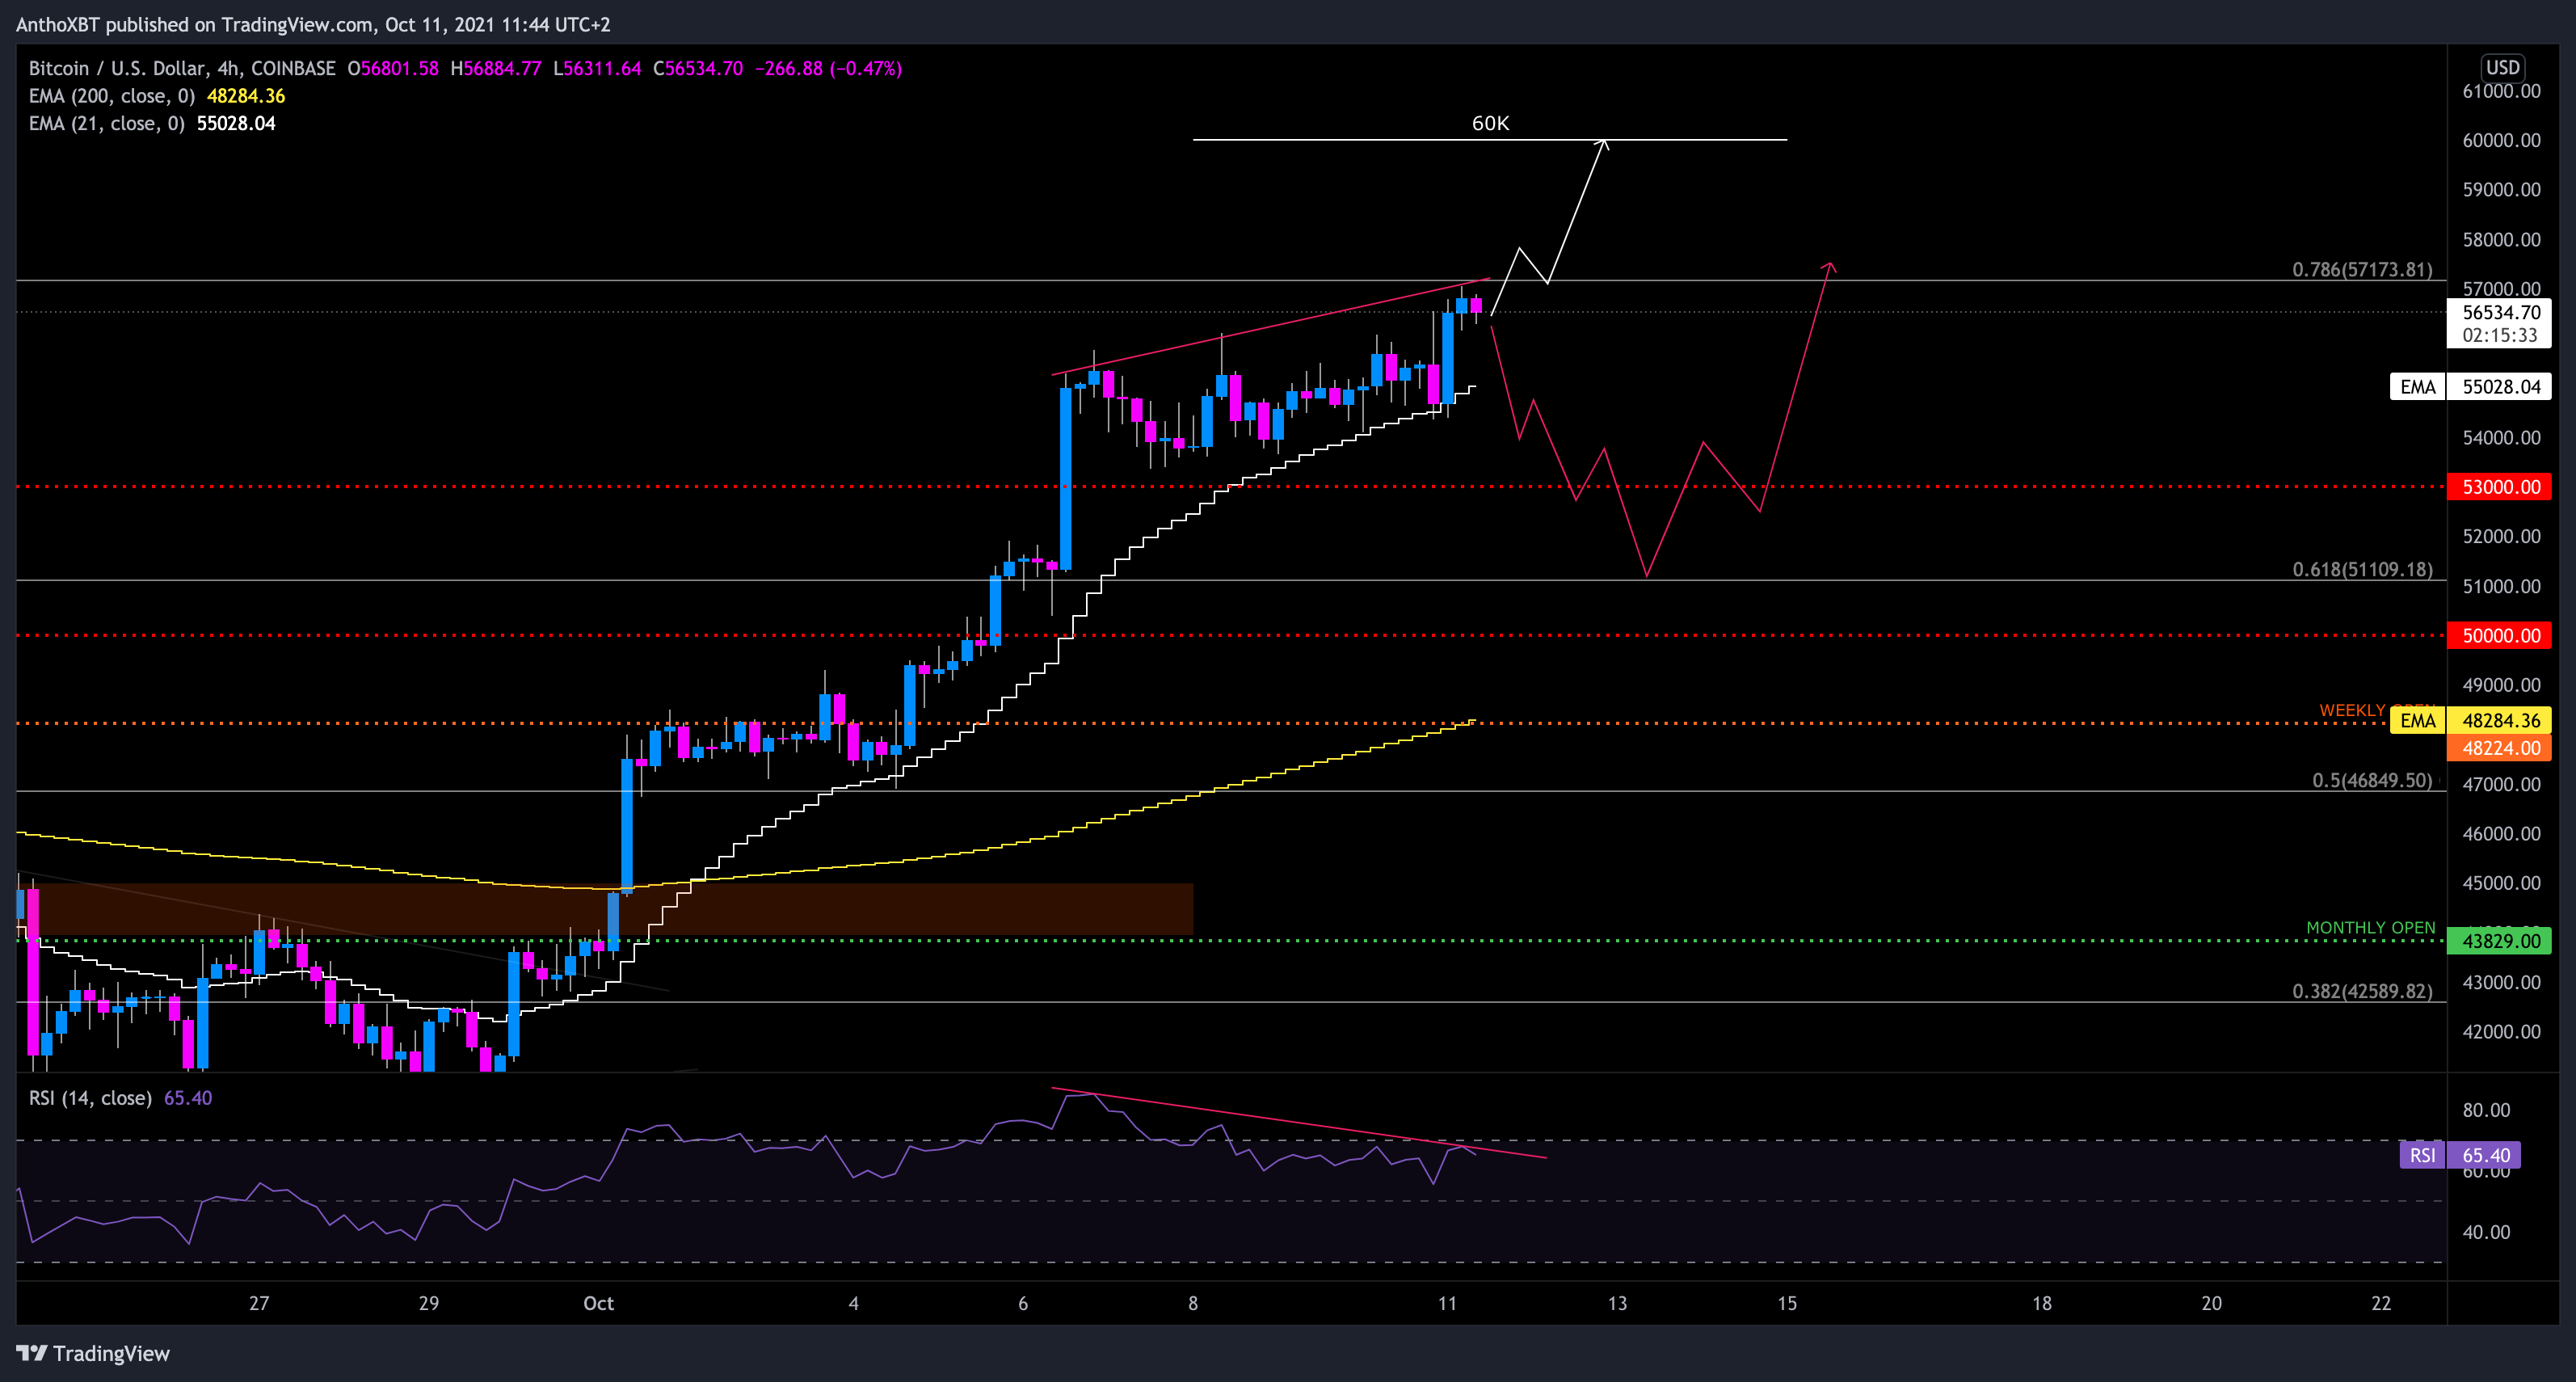
In my last Bitcoin technical analysis, I shared the two scenarios above. I was expecting the second scenario (red) to happen but bulls was too strong and turned the week in “up only” mode and even managed to make the highest weekly close in Bitcoin history! So, what can we expect from here?
2. Fibonacci Levels

Well… What can I say? Beauty. After a consolidation below resistance at the 0.786 fib ($57,170), Bitcoin printed a huge green daily candle toward $62,000+!
And guess what? The next fib is the 100% retracement level, that’s mean, the previous ATH. I’m expecting a new All Time High soon on Bitcoin before any retracement.
3. Highest Weekly Close in Bitcoin History!
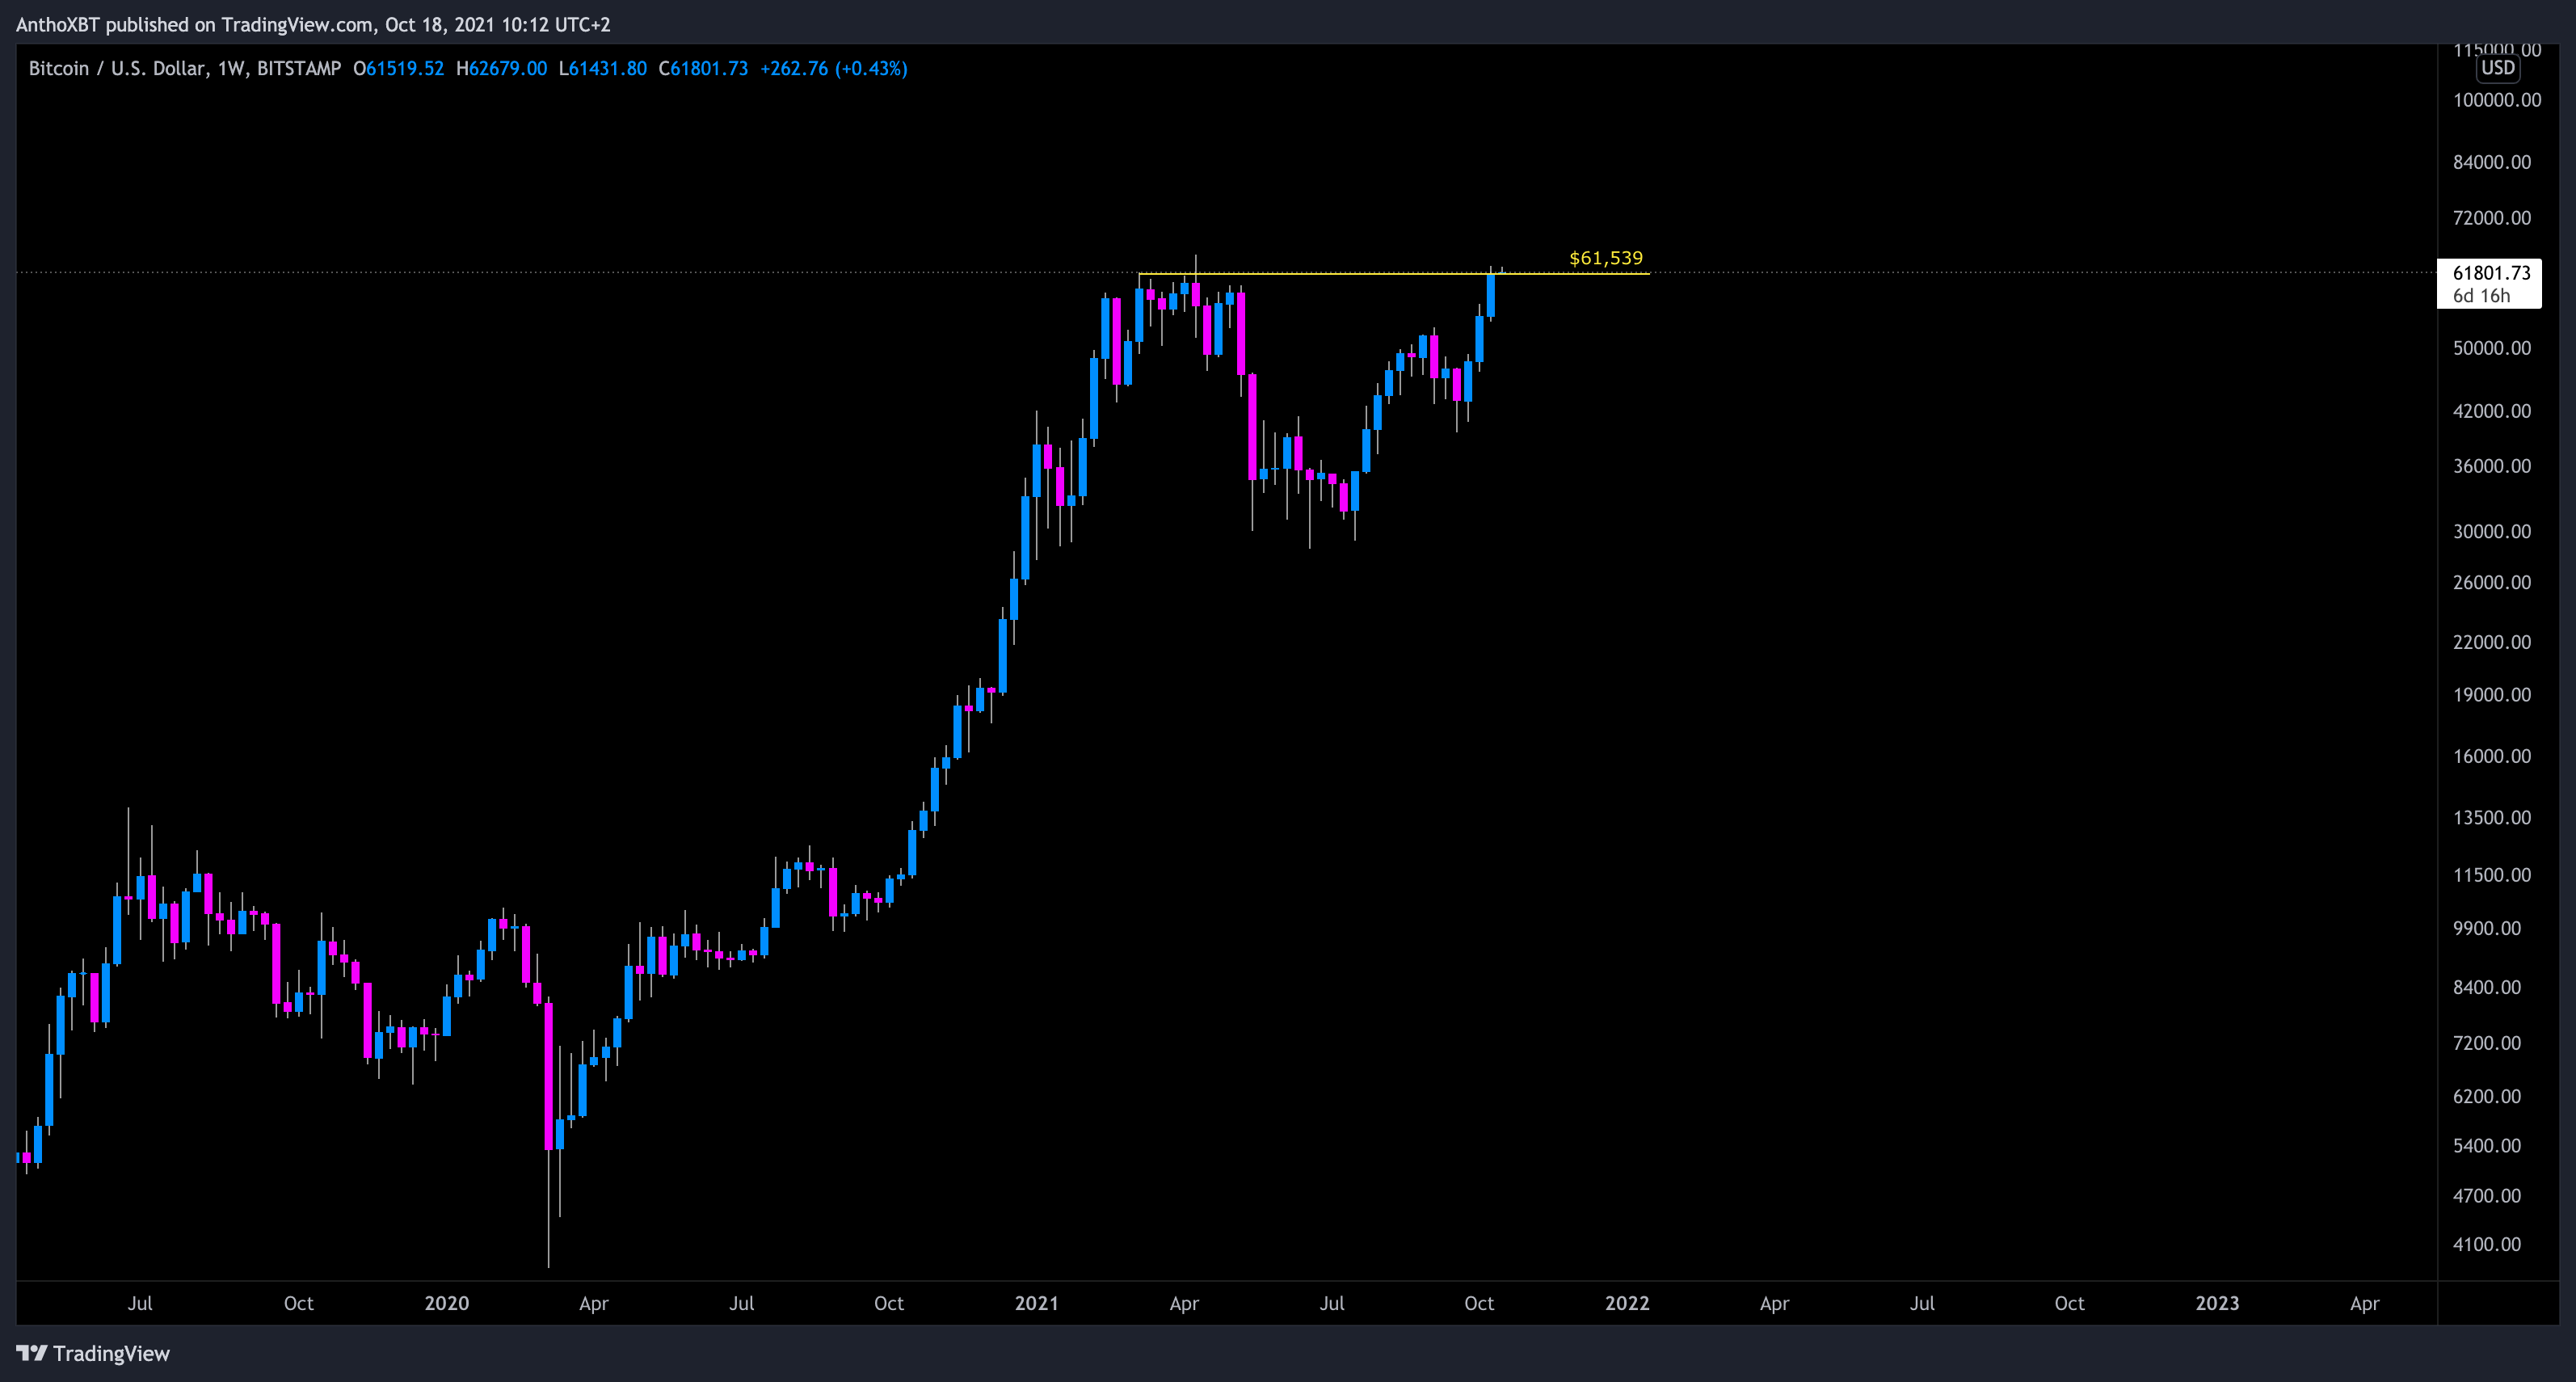
And here it is! THE HIGHEST WEEKLY CLOSE IN BITCOIN HISTORY!
Do you remember few weeks ago when Bitcoin was worth half of today's price?
This weekly candle who closed at $61,539 (Bitstamp), is very bullish and I’m expecting a new ATH very soon for the King.
4. Fractal to ATH

I like fractal because they clearly represent the cyclical movements of an asset. Often, these movements are repeated with great precision and allow us to have an overview of the upcoming candles.
The fractal above is from the area in the grey box and this is the kind of move I’m expecting toward the current ATH.
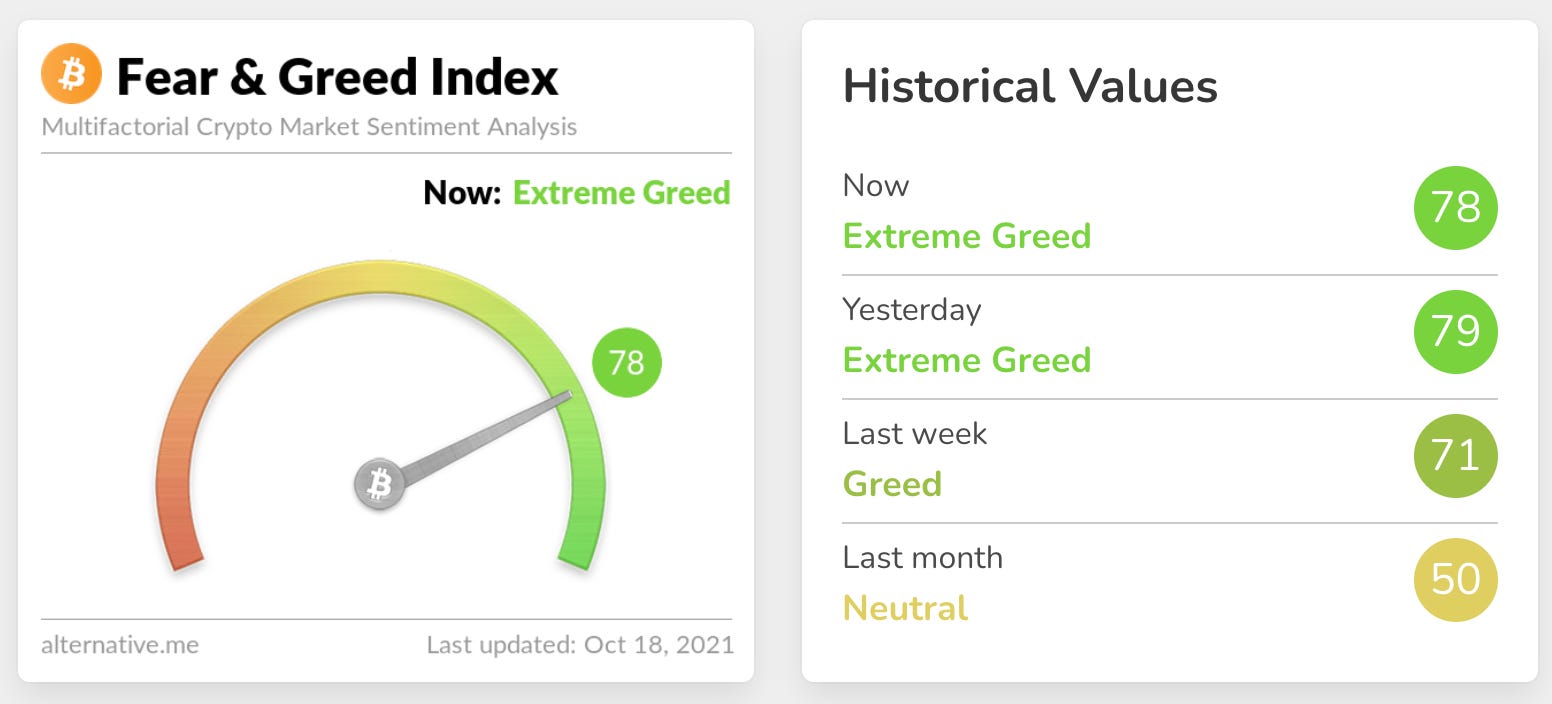
5. Fear & Green Index

The Fear & Greed Index is now in “Extreme Greed”, close to the last high we had in August. To be honest, we are not in an easy area to play with altcoins, Bitcoin should print strong movements with a lot of volatility and altcoins will be (very) impacted because of the Bitcoin’s Dominance (see next topic).
6. Bitcoin Dominance (BTC.D)
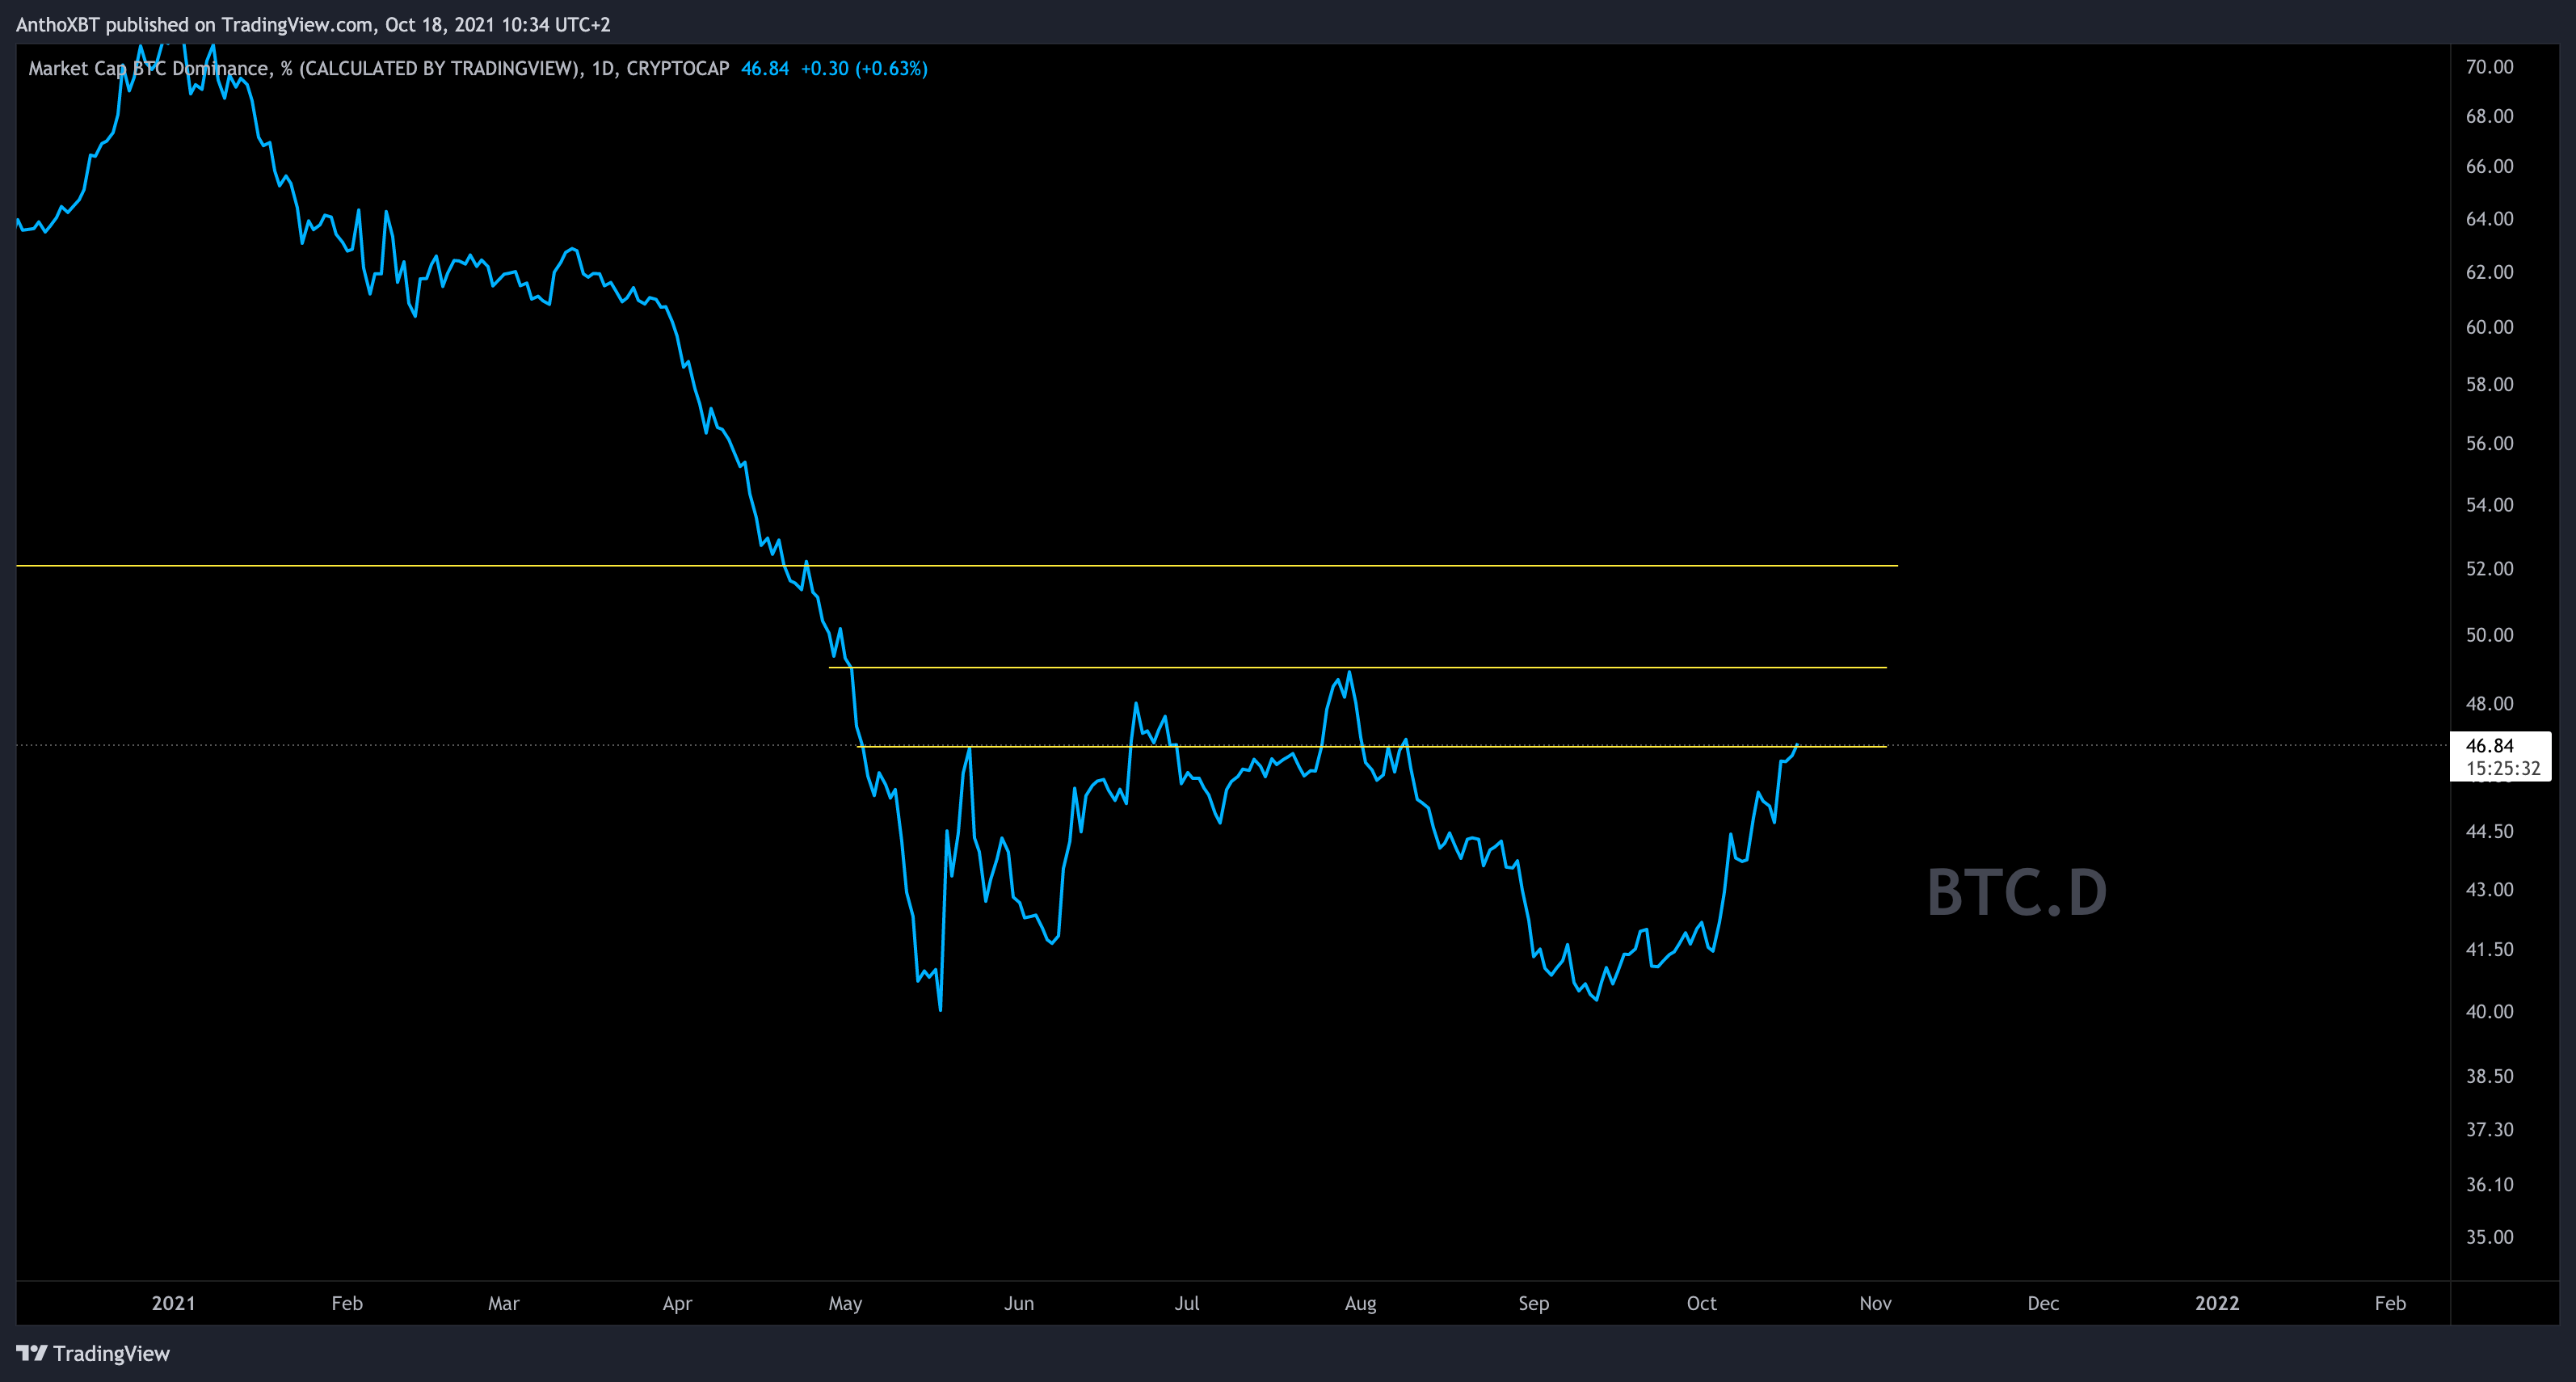
It’s hard to be bearish on this chart. BTC.D should go higher for few days (maybe more than a week) before cooling off and let alts breathe.
So, one more time, if you’re trading altcoins, please, be careful! You need to choose altcoins with strong BTC Pair to reduce your risk in the case of a sudden movement in Bitcoin.
7. Weekly Plan
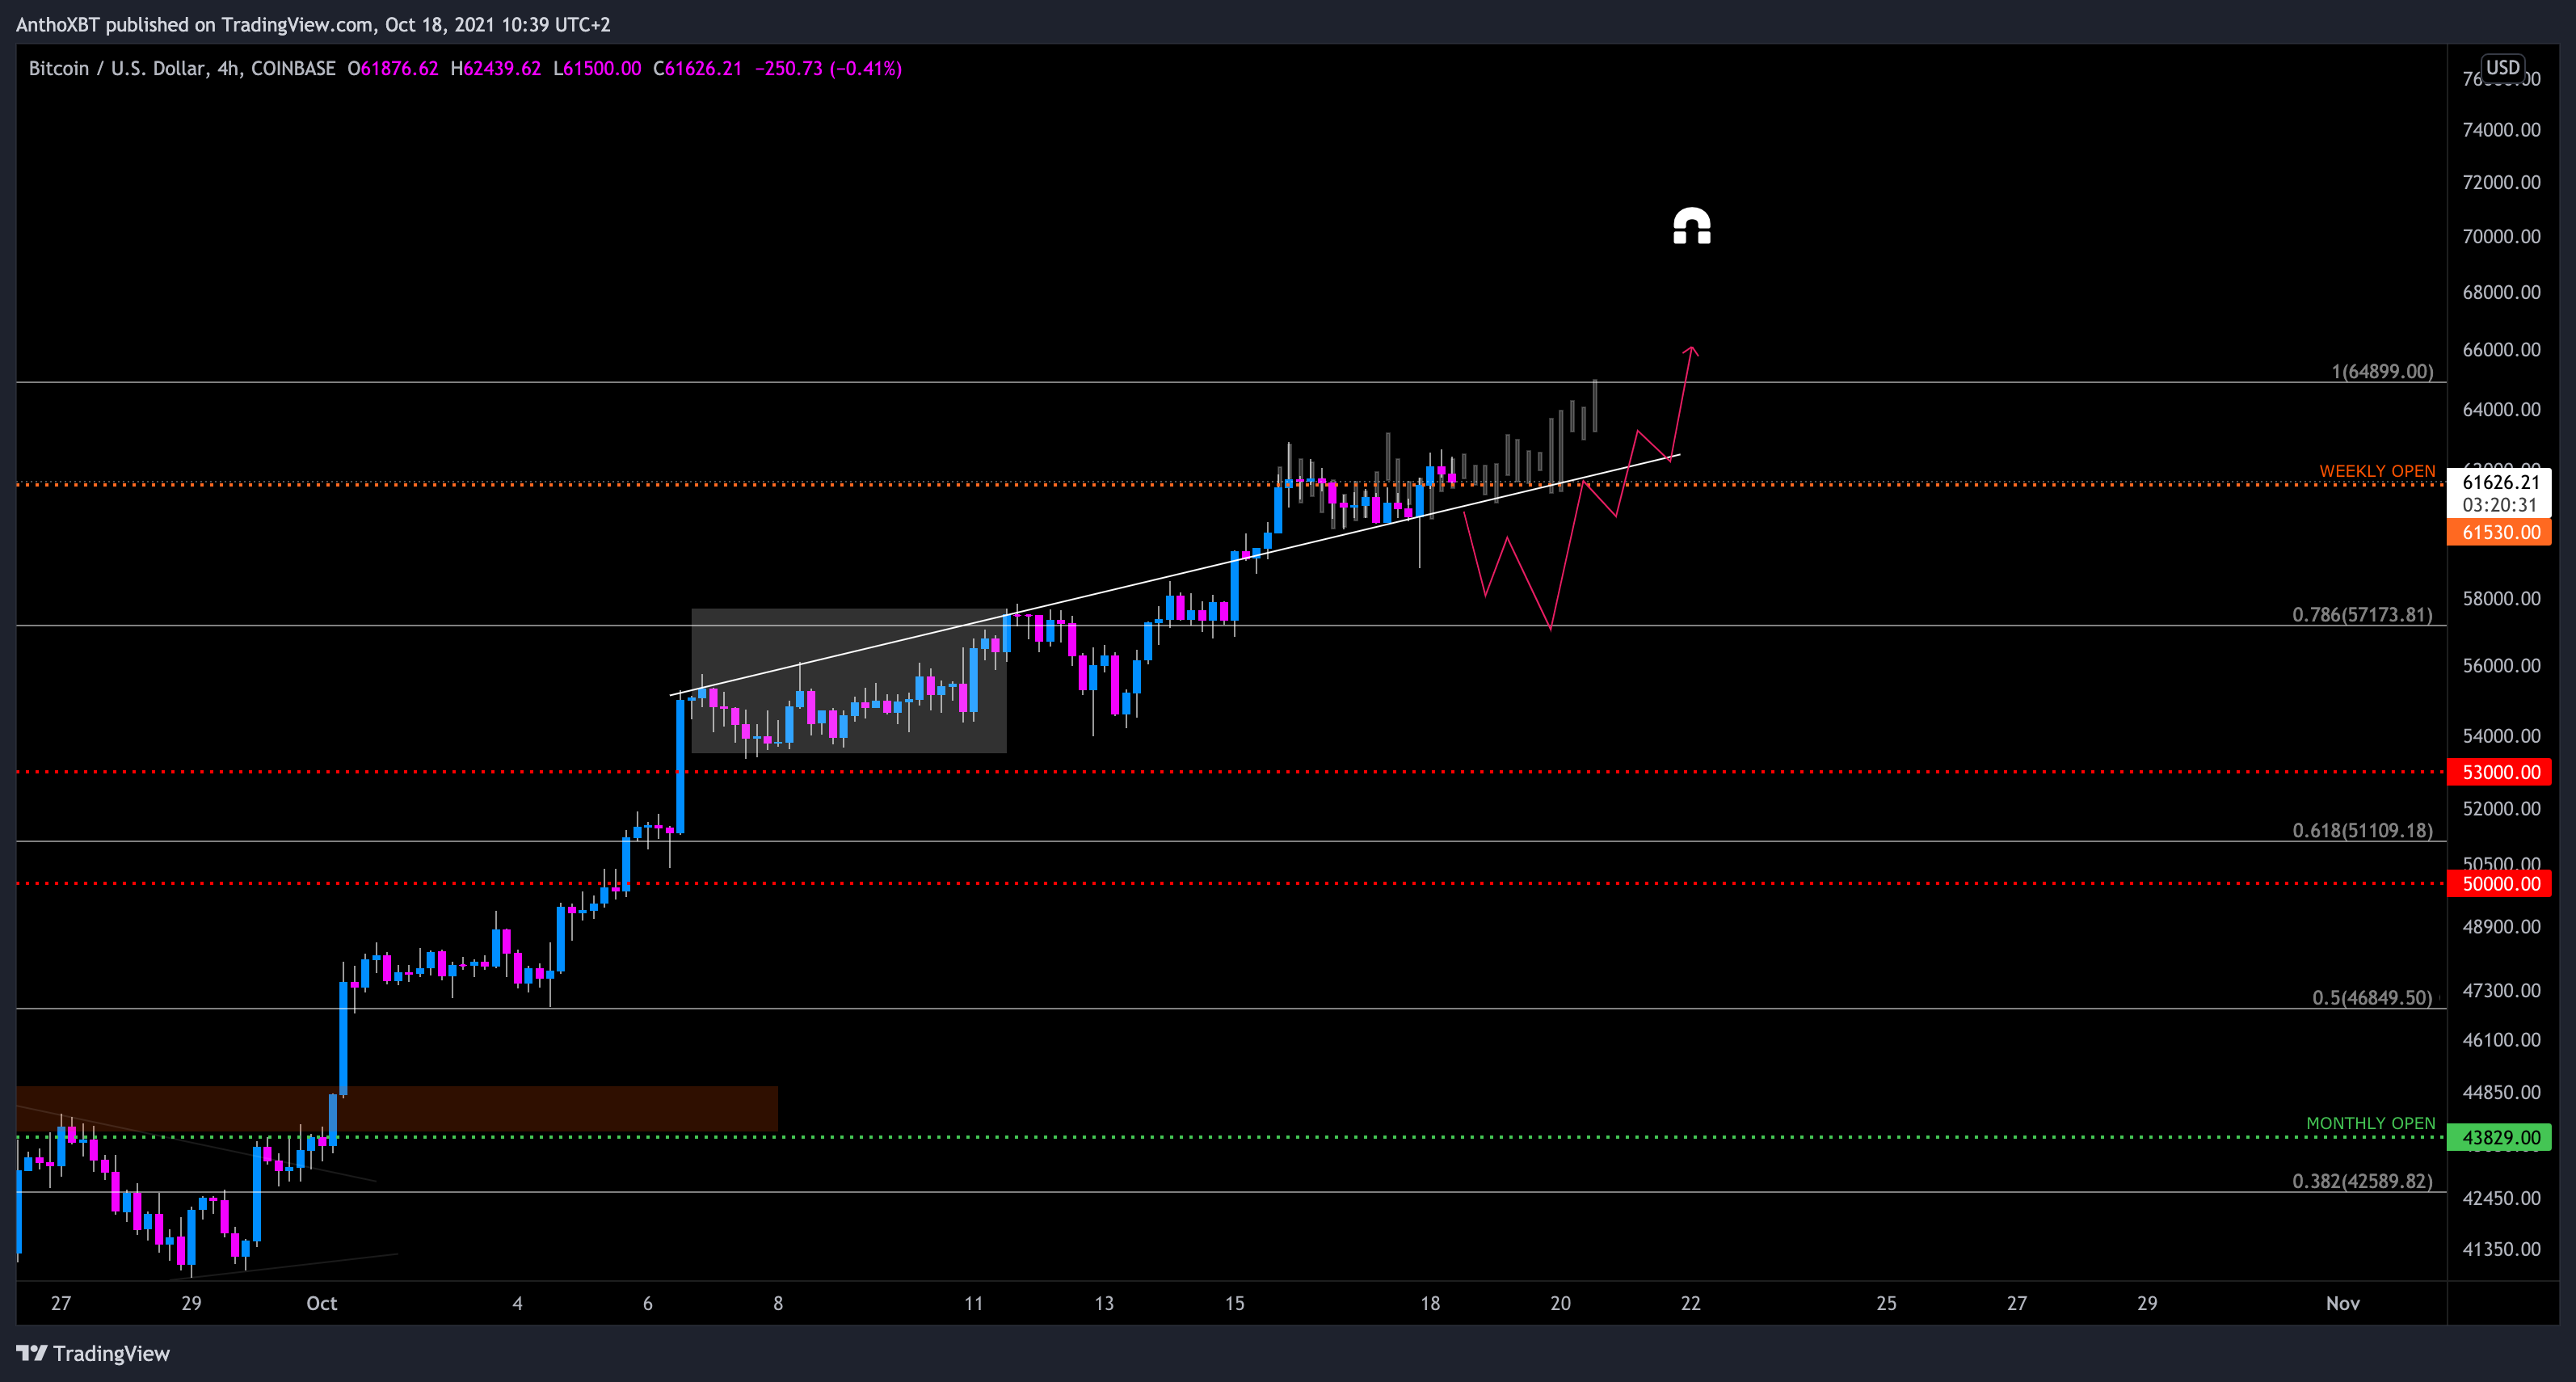
7.1. First scenario (same fractal):
Bitcoin continue tp push higher above its previous diagonal resistance (flipped as support) and reach its previous ATH at $64,900.
Once this level is reached, we should see an acceleration toward $70,000 before the correction.
7.2. Second scenario:
The current support failed to hold and Bitcoin go back to $57,000 (0.786 fib)
Go back to the weekly open/diagonal resistance and flip them as support
Push hard to a new ATH with an healthy uptrend.
Note: The first scenario is the most probable imo, we should see a new ATH before any correction.
8. Overall,
…what a week for the King! Up more than $6,500 and printed its highest weekly close in its history. I’m (as everyone), very bullish for this Q4, everything is moving perfectly, Bitcoin first, high cap, mid cap and at the end, low cap.
You need few more weeks of patience before the alt season you’re waiting for. Trust me, it's worth the wait. WGMI!
If you like it, don’t forget to subscribe, share and follow theses account on Twitter: @AnthoXBT & @ApeBaguette