

Bitcoin Technical Analysis Update - Week 32
Bitcoin Technical Analysis Update - Week 32
The king finally breakout the top of its range. After reaching $45,000, it seems essential for the bulls to hold $42,000 as support to expect further upside.

Summary
Previous Analysis
Range Breakout
EMA 21, 100 & 200 (Daily)
3.1 Golden CrossFibonacci Levels
Weekly Close
Weekly Plan
The Big Picture
Overall
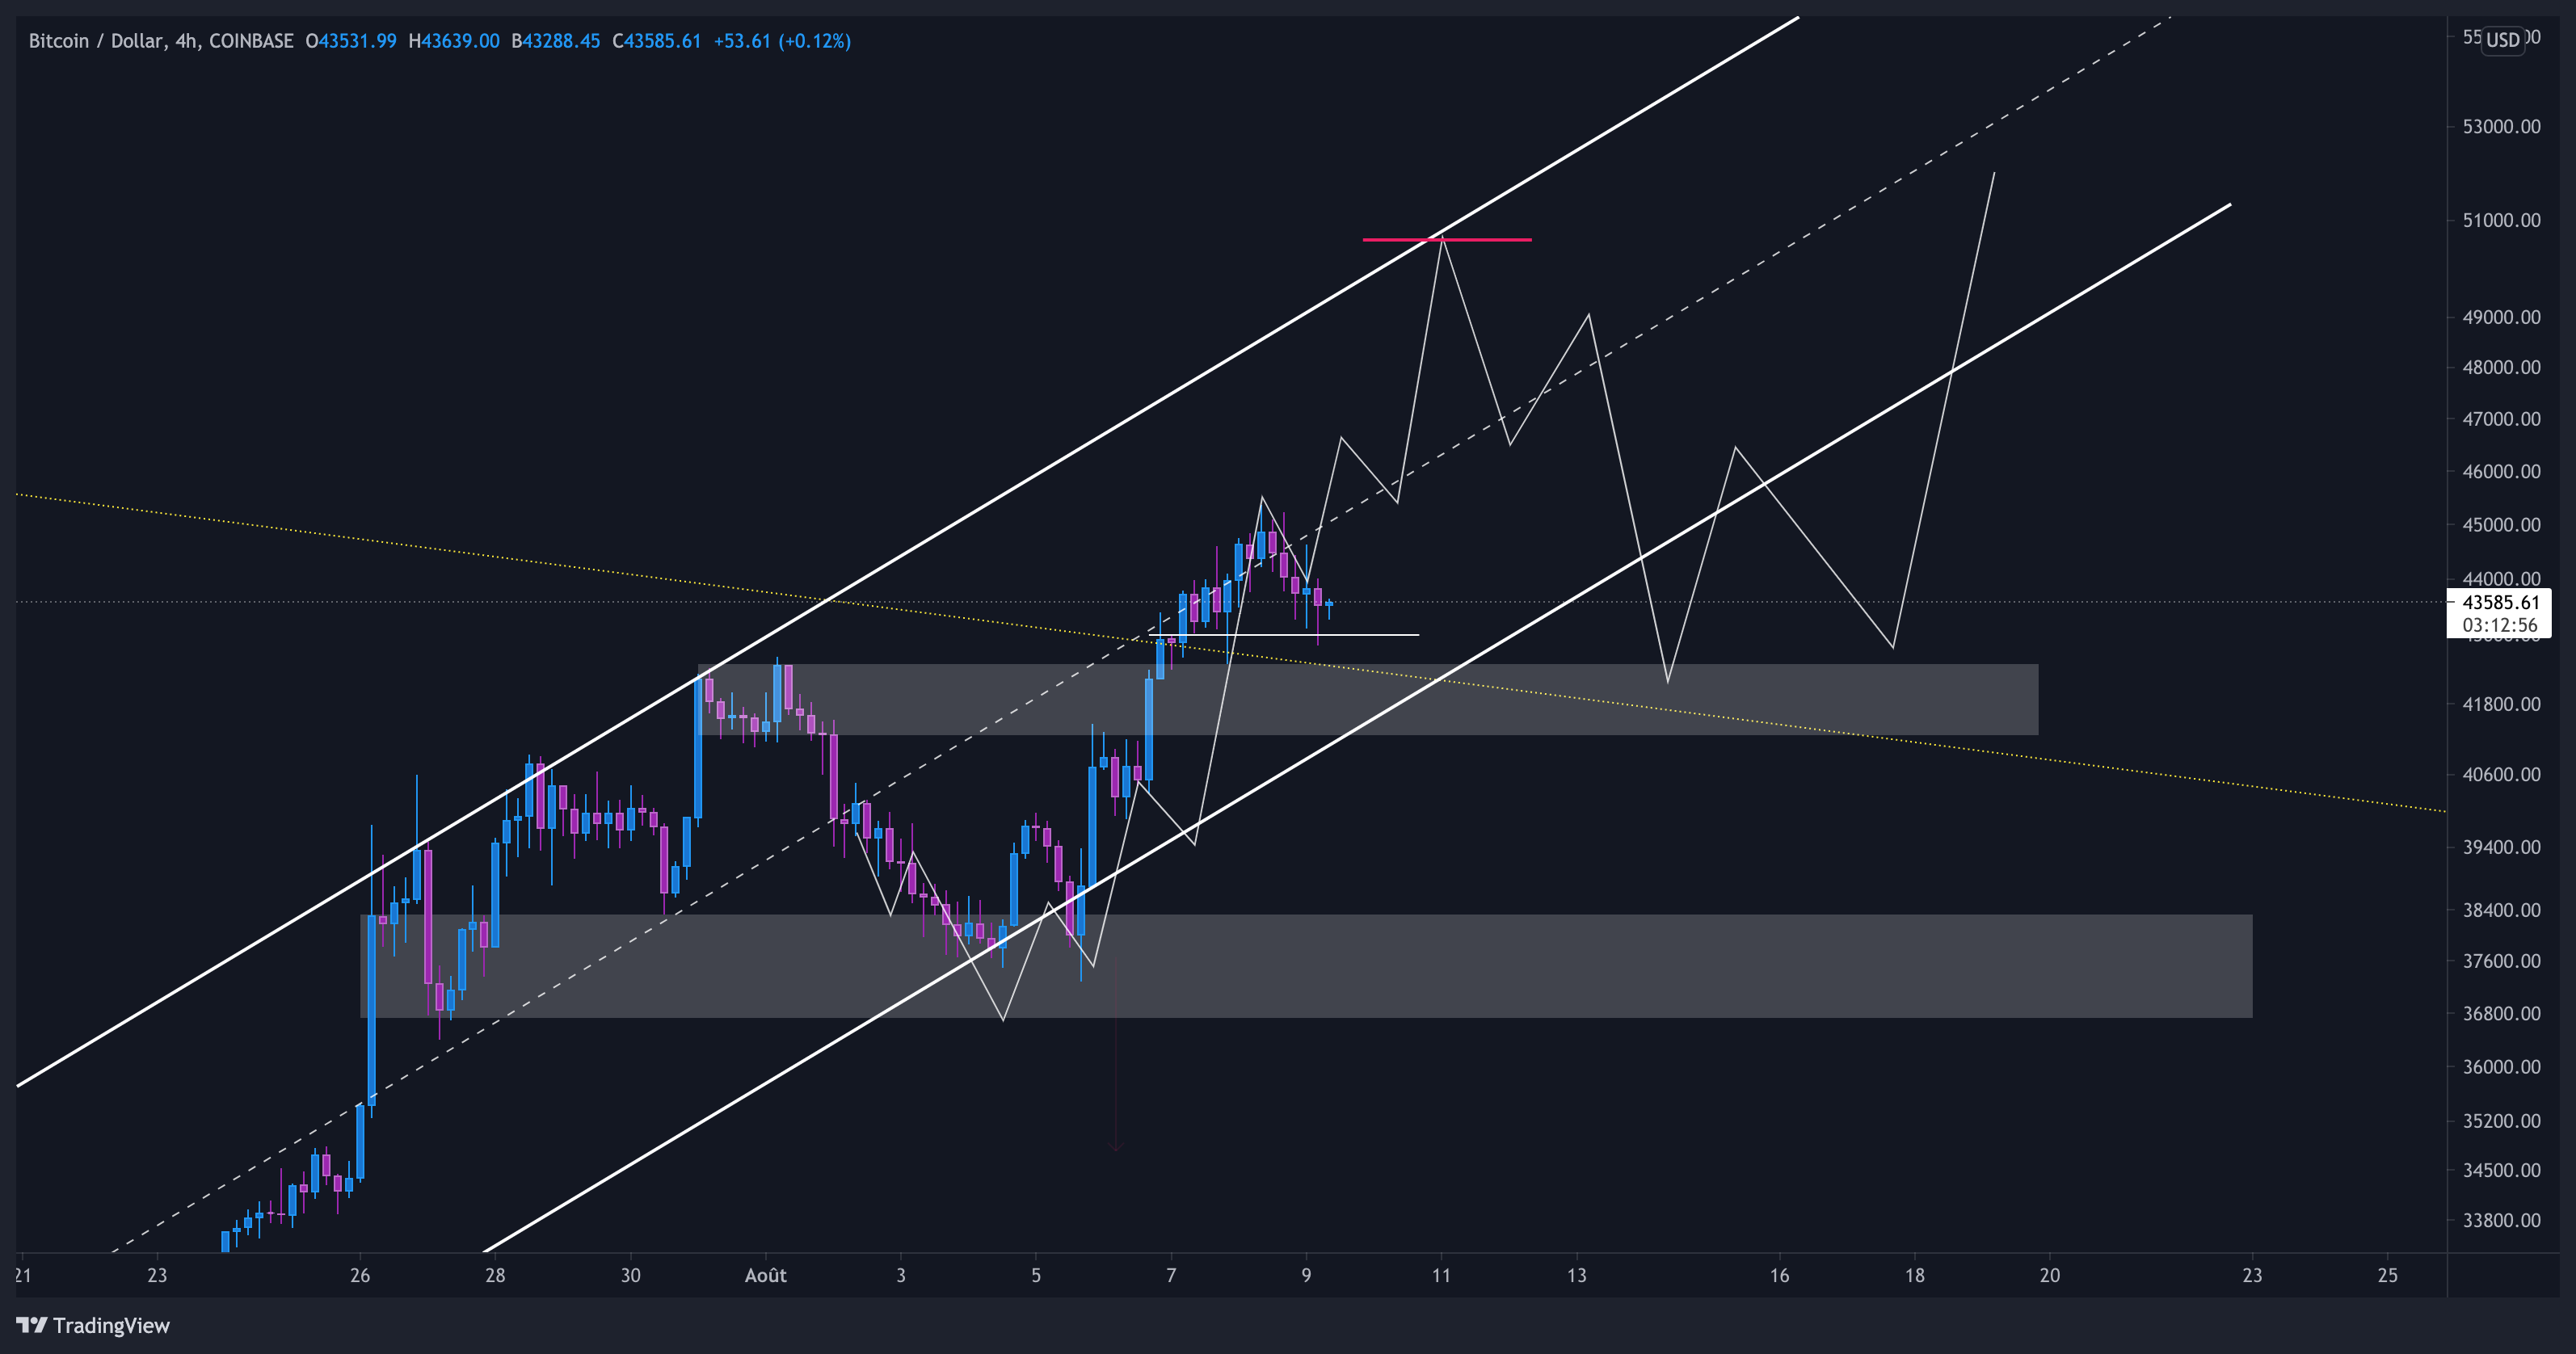
Previous Analysis
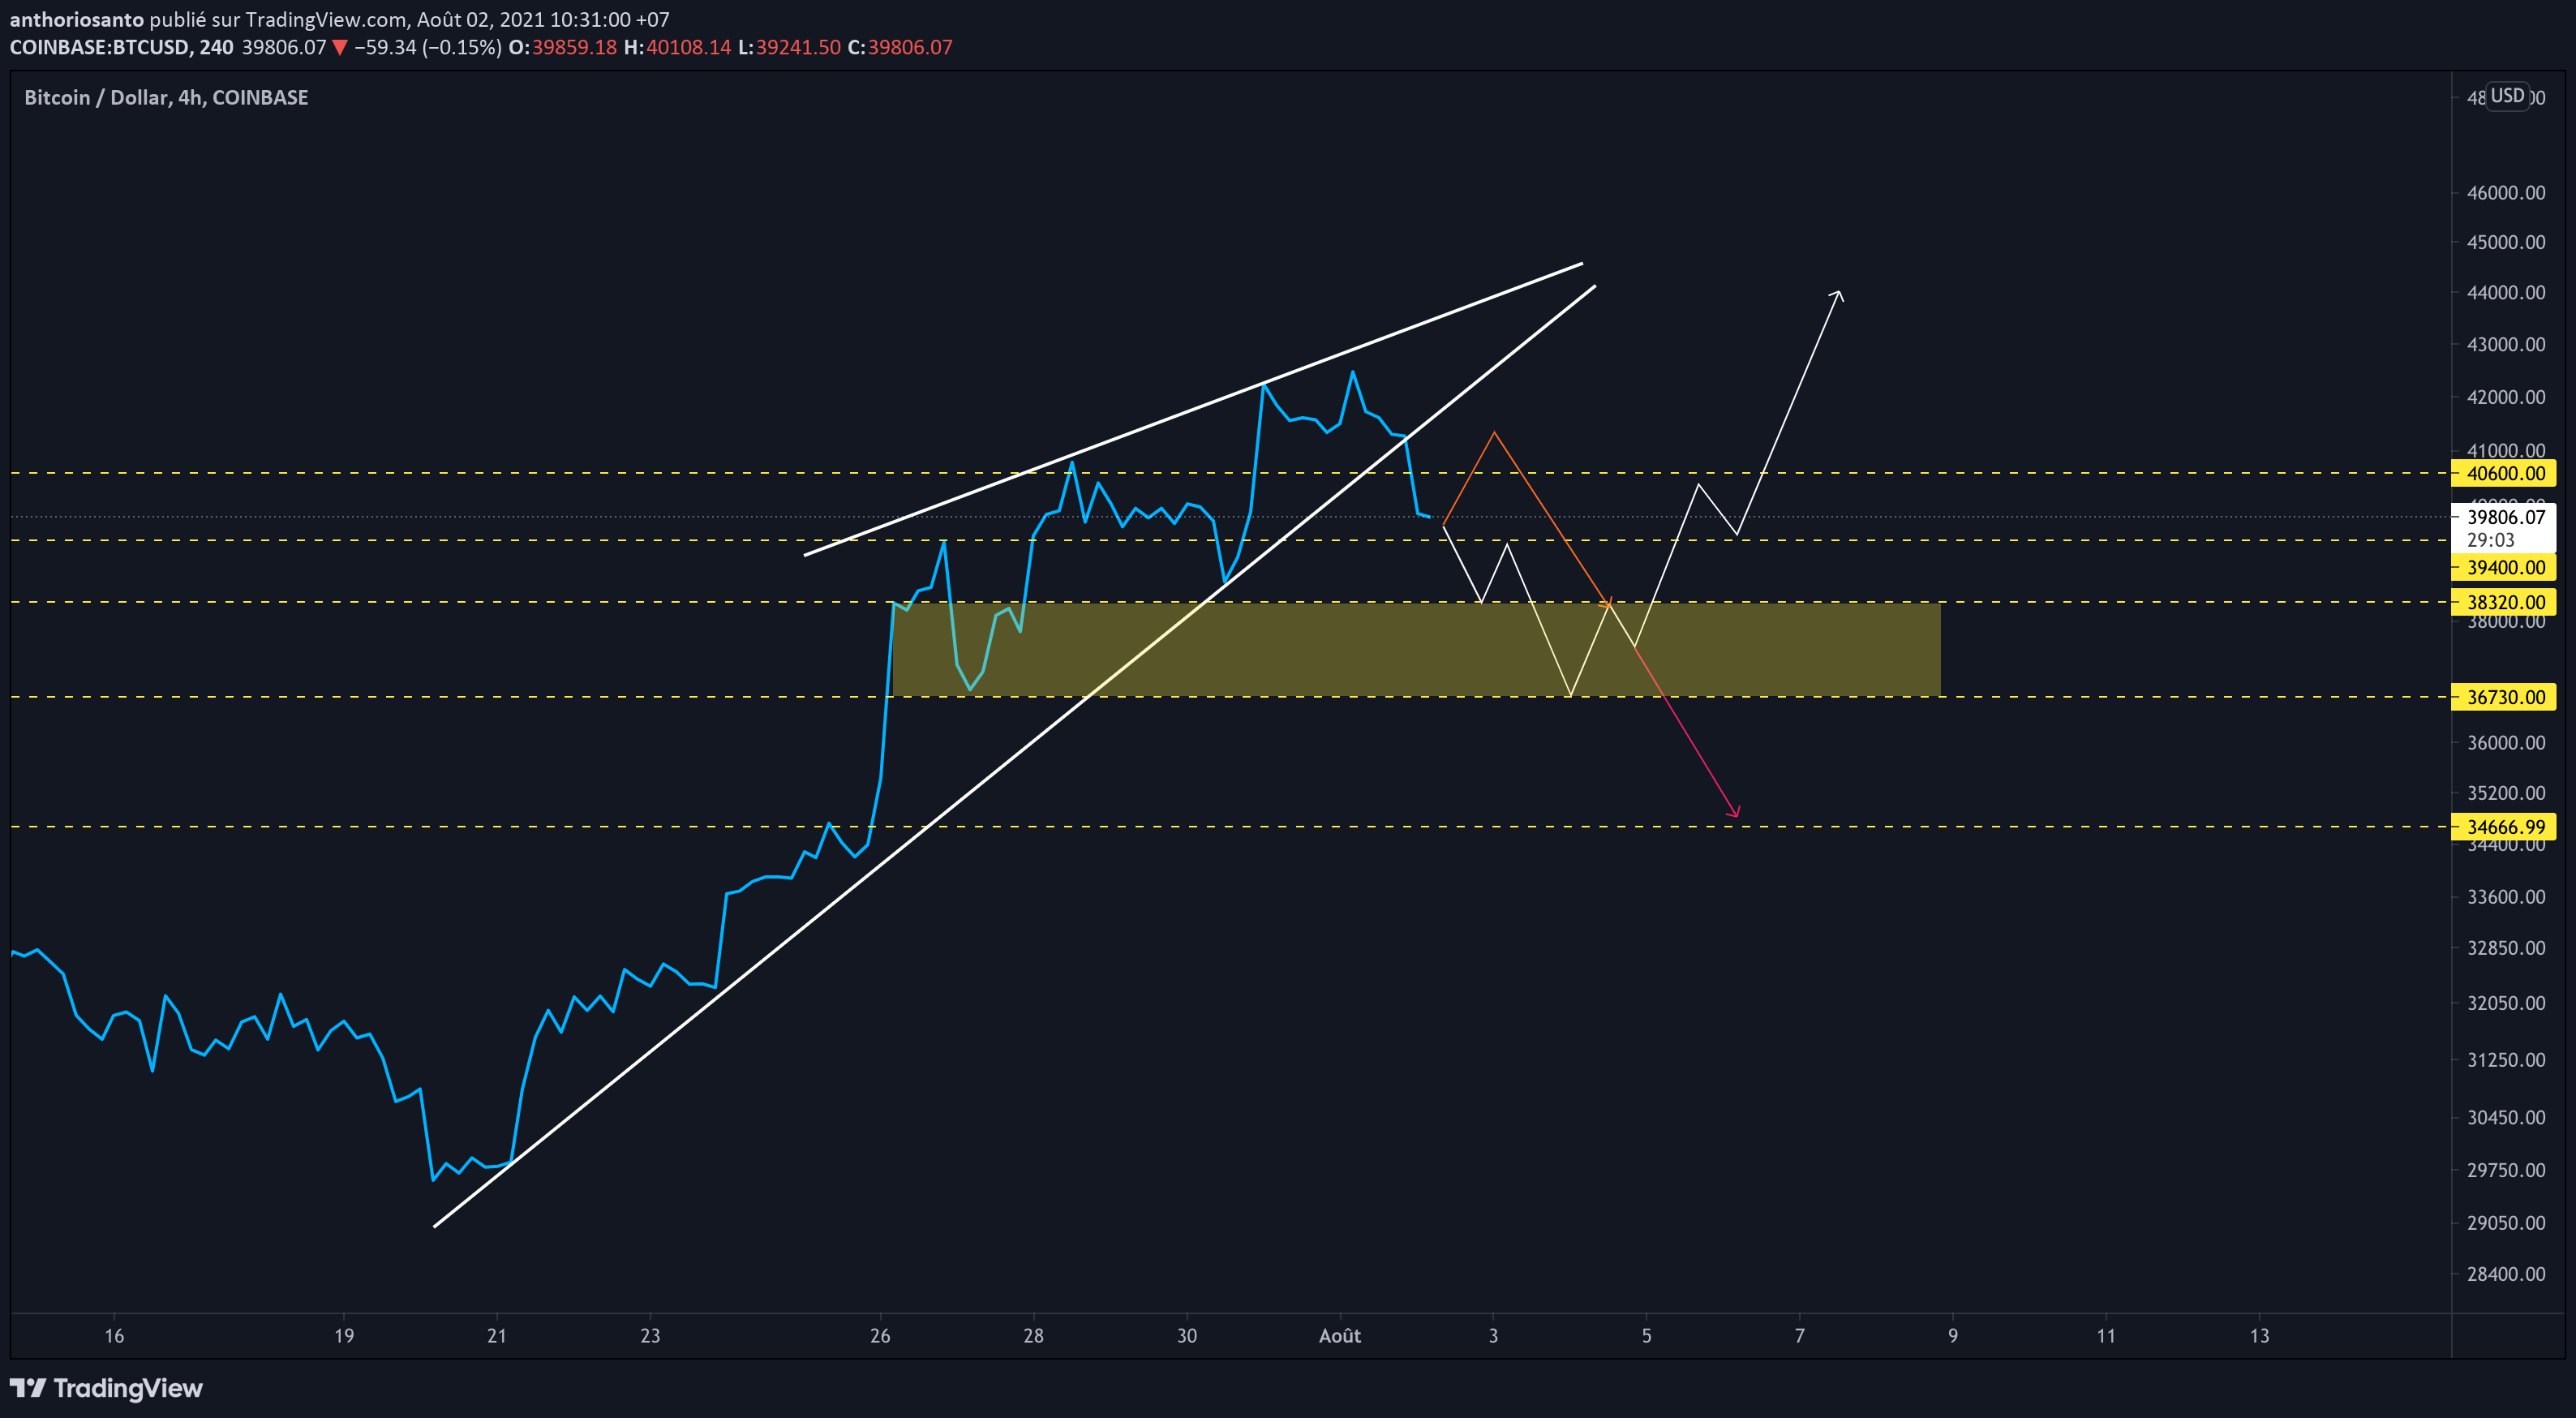
In my last Bitcoin technical analysis, I have drawn theses potential scenarios and Bitcoin choose the white one. $36,000 area has not been reached because bulls defended $38,000 for few days and held it well!
This support send Bitcoin above $45,000 by the end of the week, and we can finally say it, we’re above key levels after few weeks in a big range.
Range Breakout
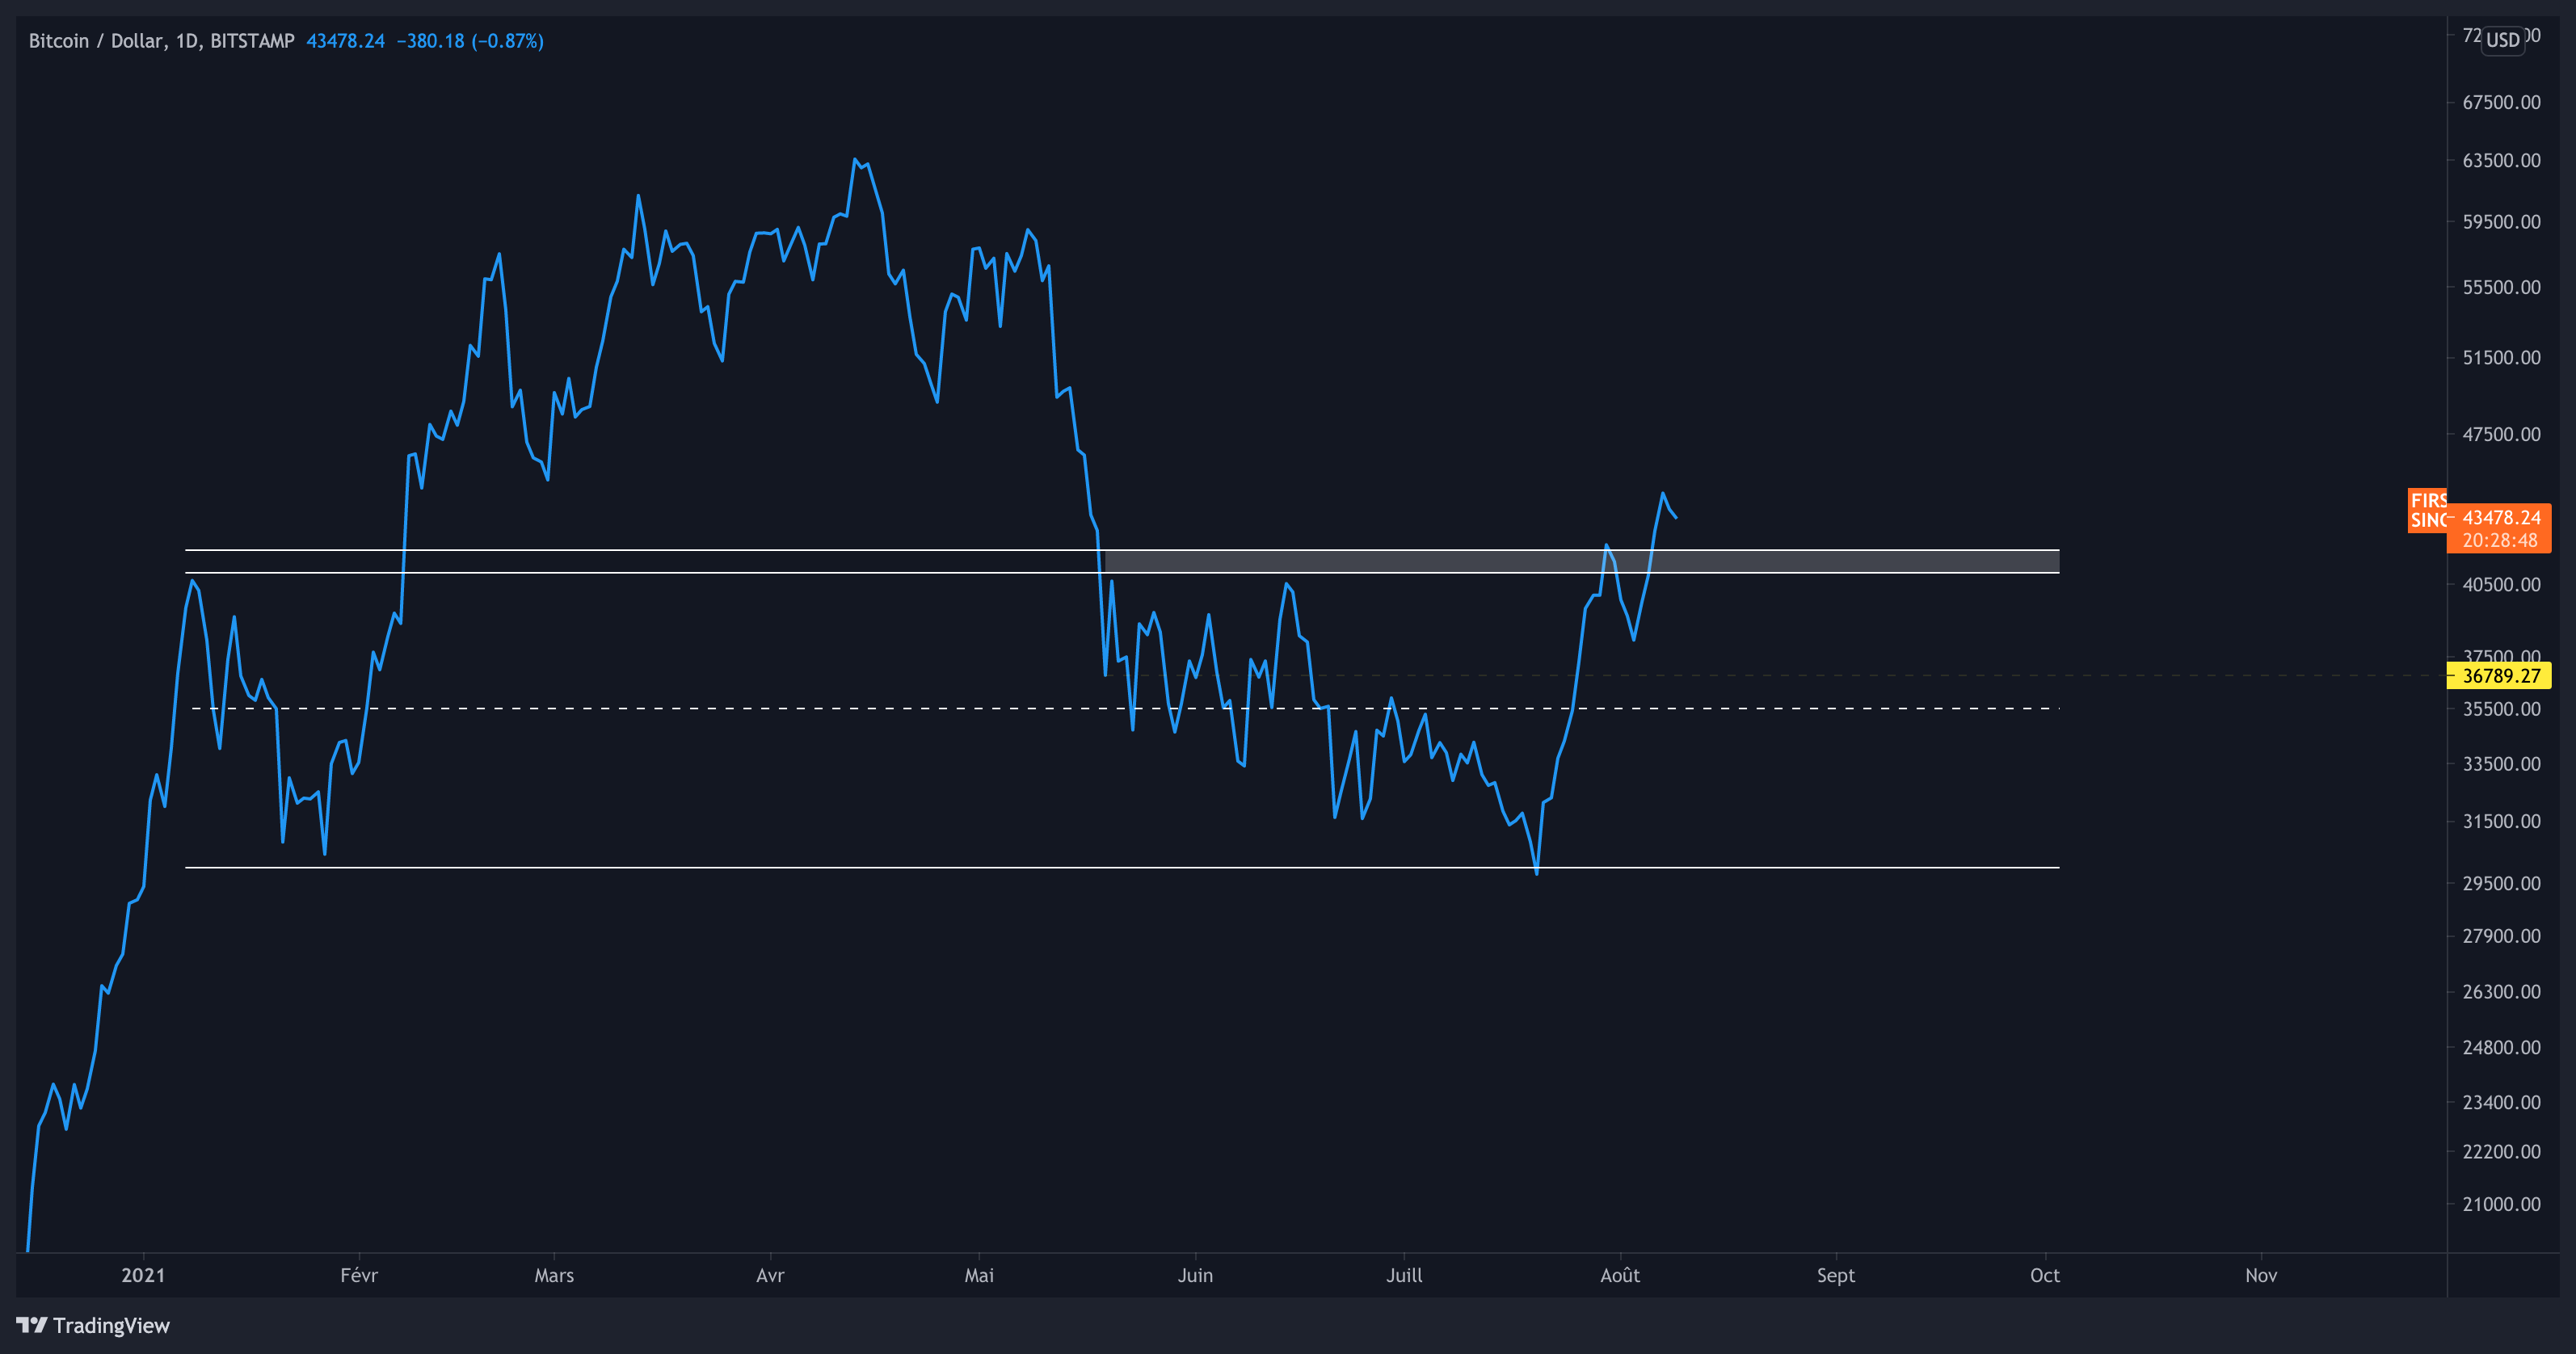
It took time to break it but we’re finally above. $41,000-$42,000 was the top of the range and Bitcoin failed few attempts to break it.
So, while I’m writing theses lines, Bitcoin is still above $43,000 but more correction should come as we still don’t retest this previous range resistance yet. I’m not saying that a retest is mandatory but it could be good to build a new higher low and confirm this R/S flip.
EMA 21, EMA 200 & EMA 100 (Daily)
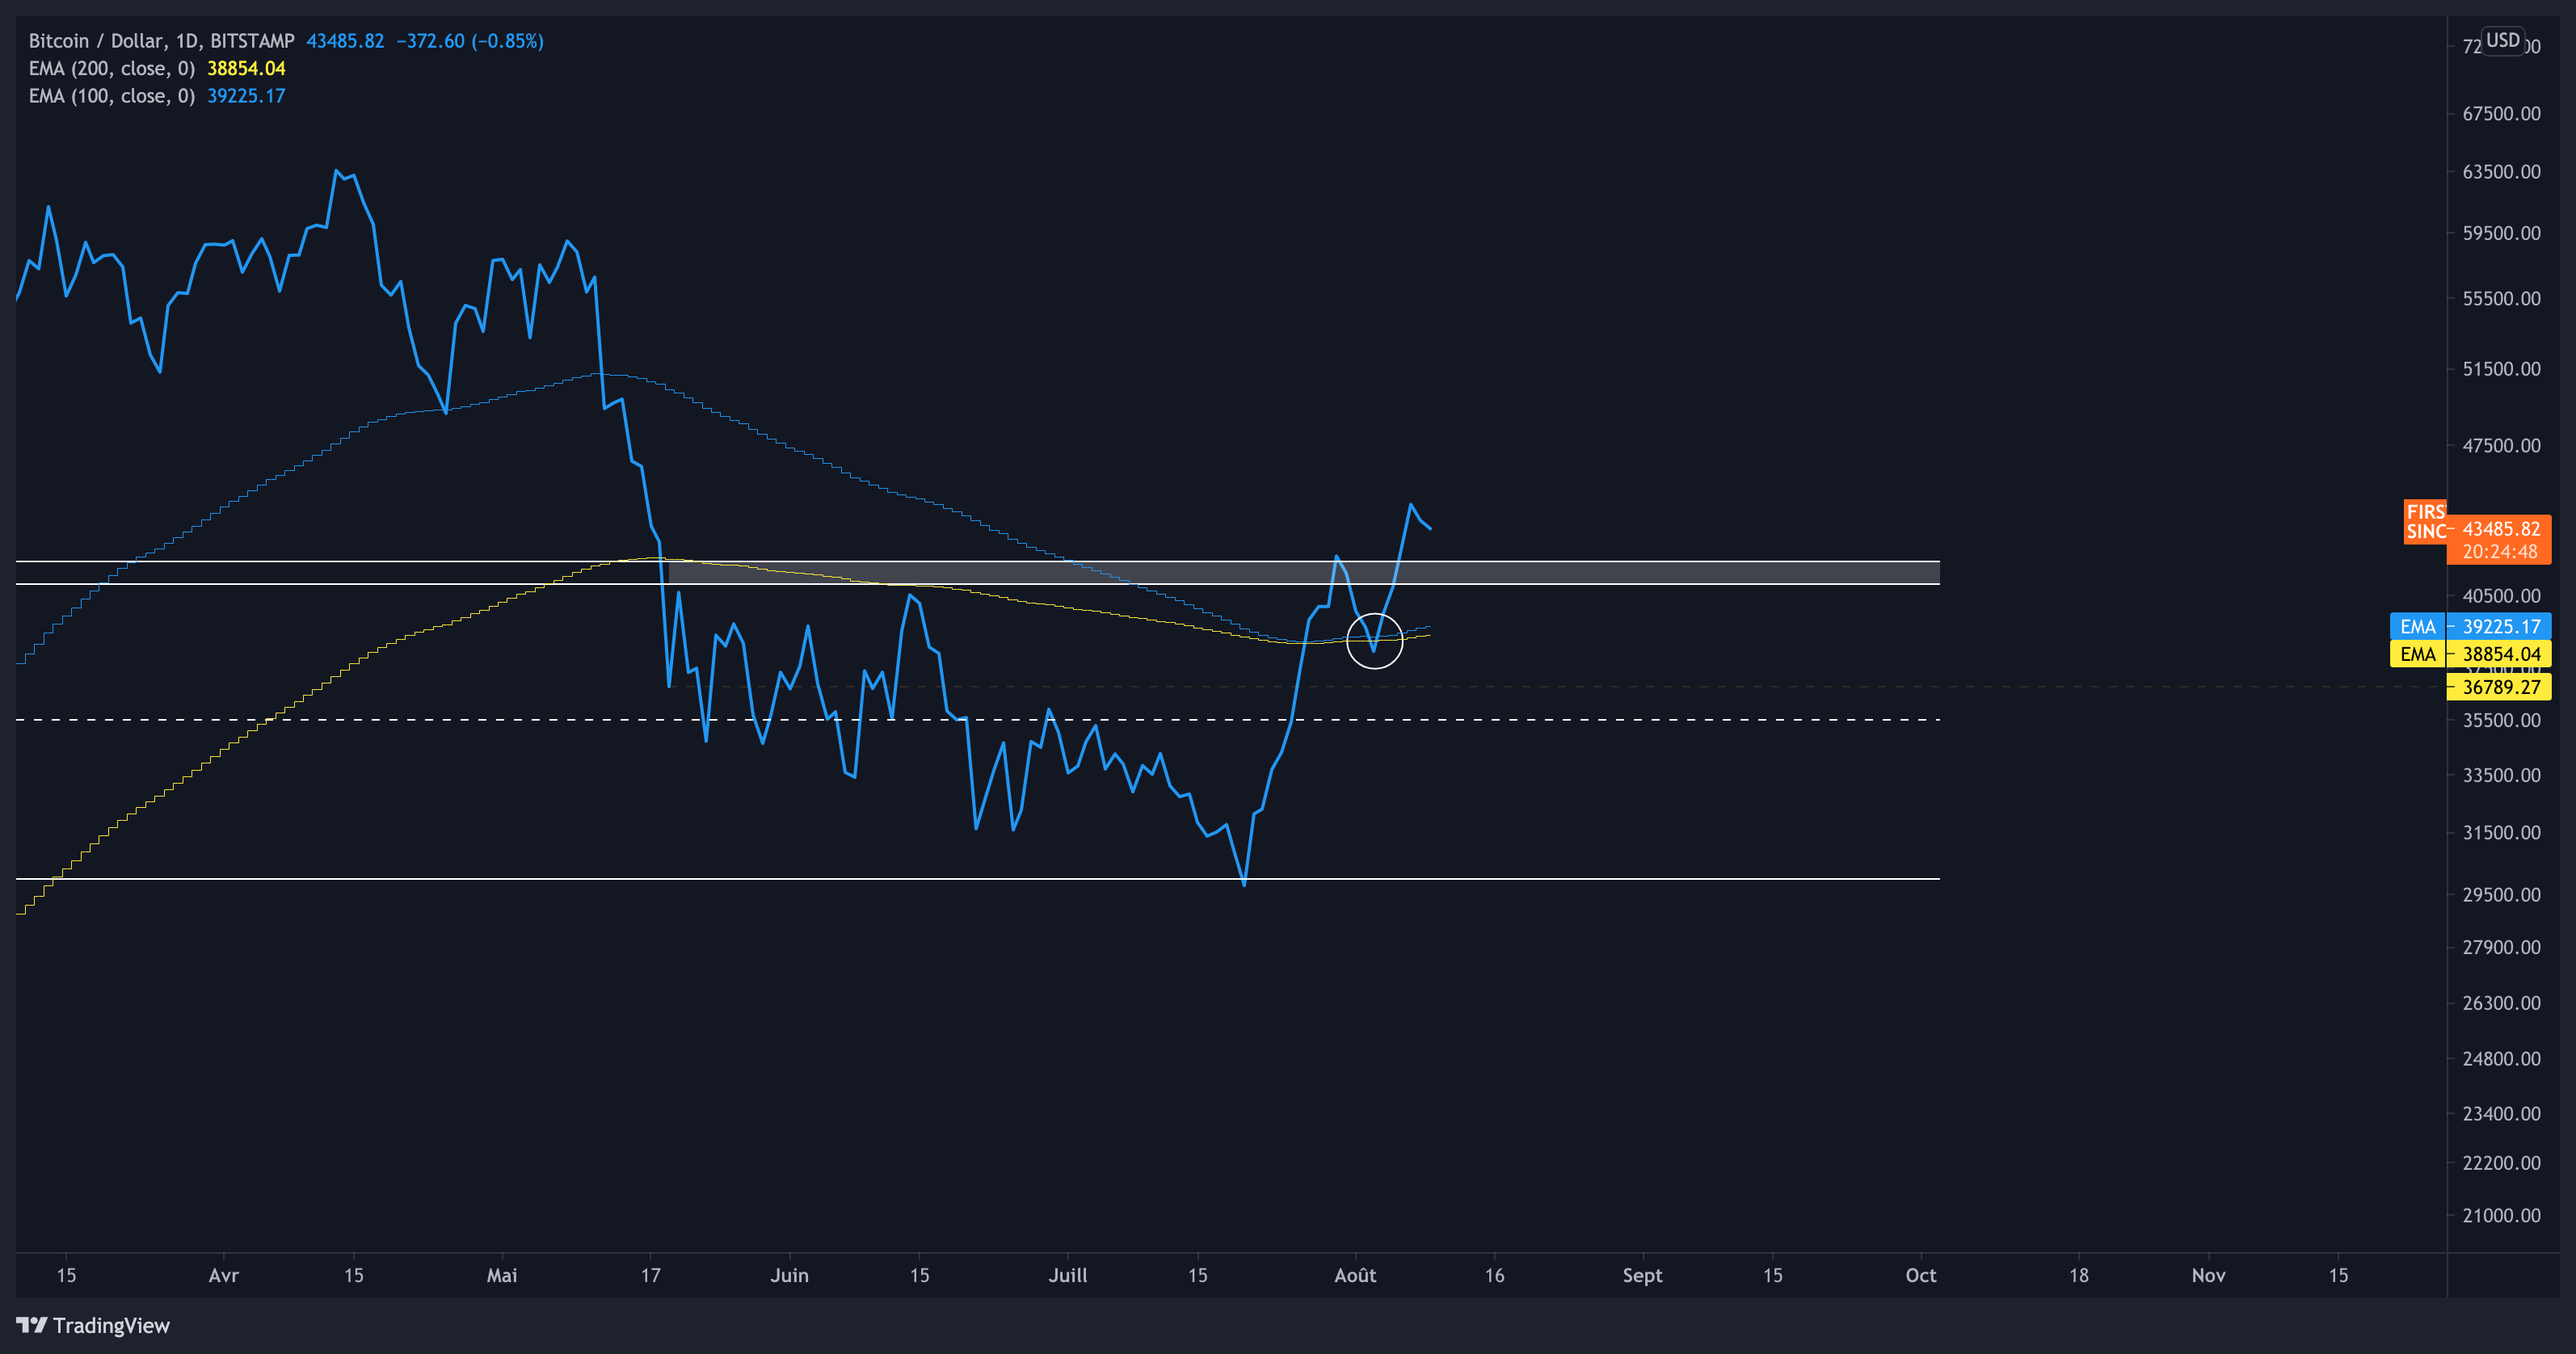
If bulls held well $38,000, if because they was helped by theses two EMA (100 & 200). In fact, in history, once they are break (in any way), they are strong support/resistance.
Golden Cross
In this weekly update, I will also talk about the EMA 21 because we have potentially a beautiful Golden Cross here.
A Golden Cross, is when short-term moving average crosses above a long-term moving average. Below, the same chart with the EMA 21 (Daily chart):
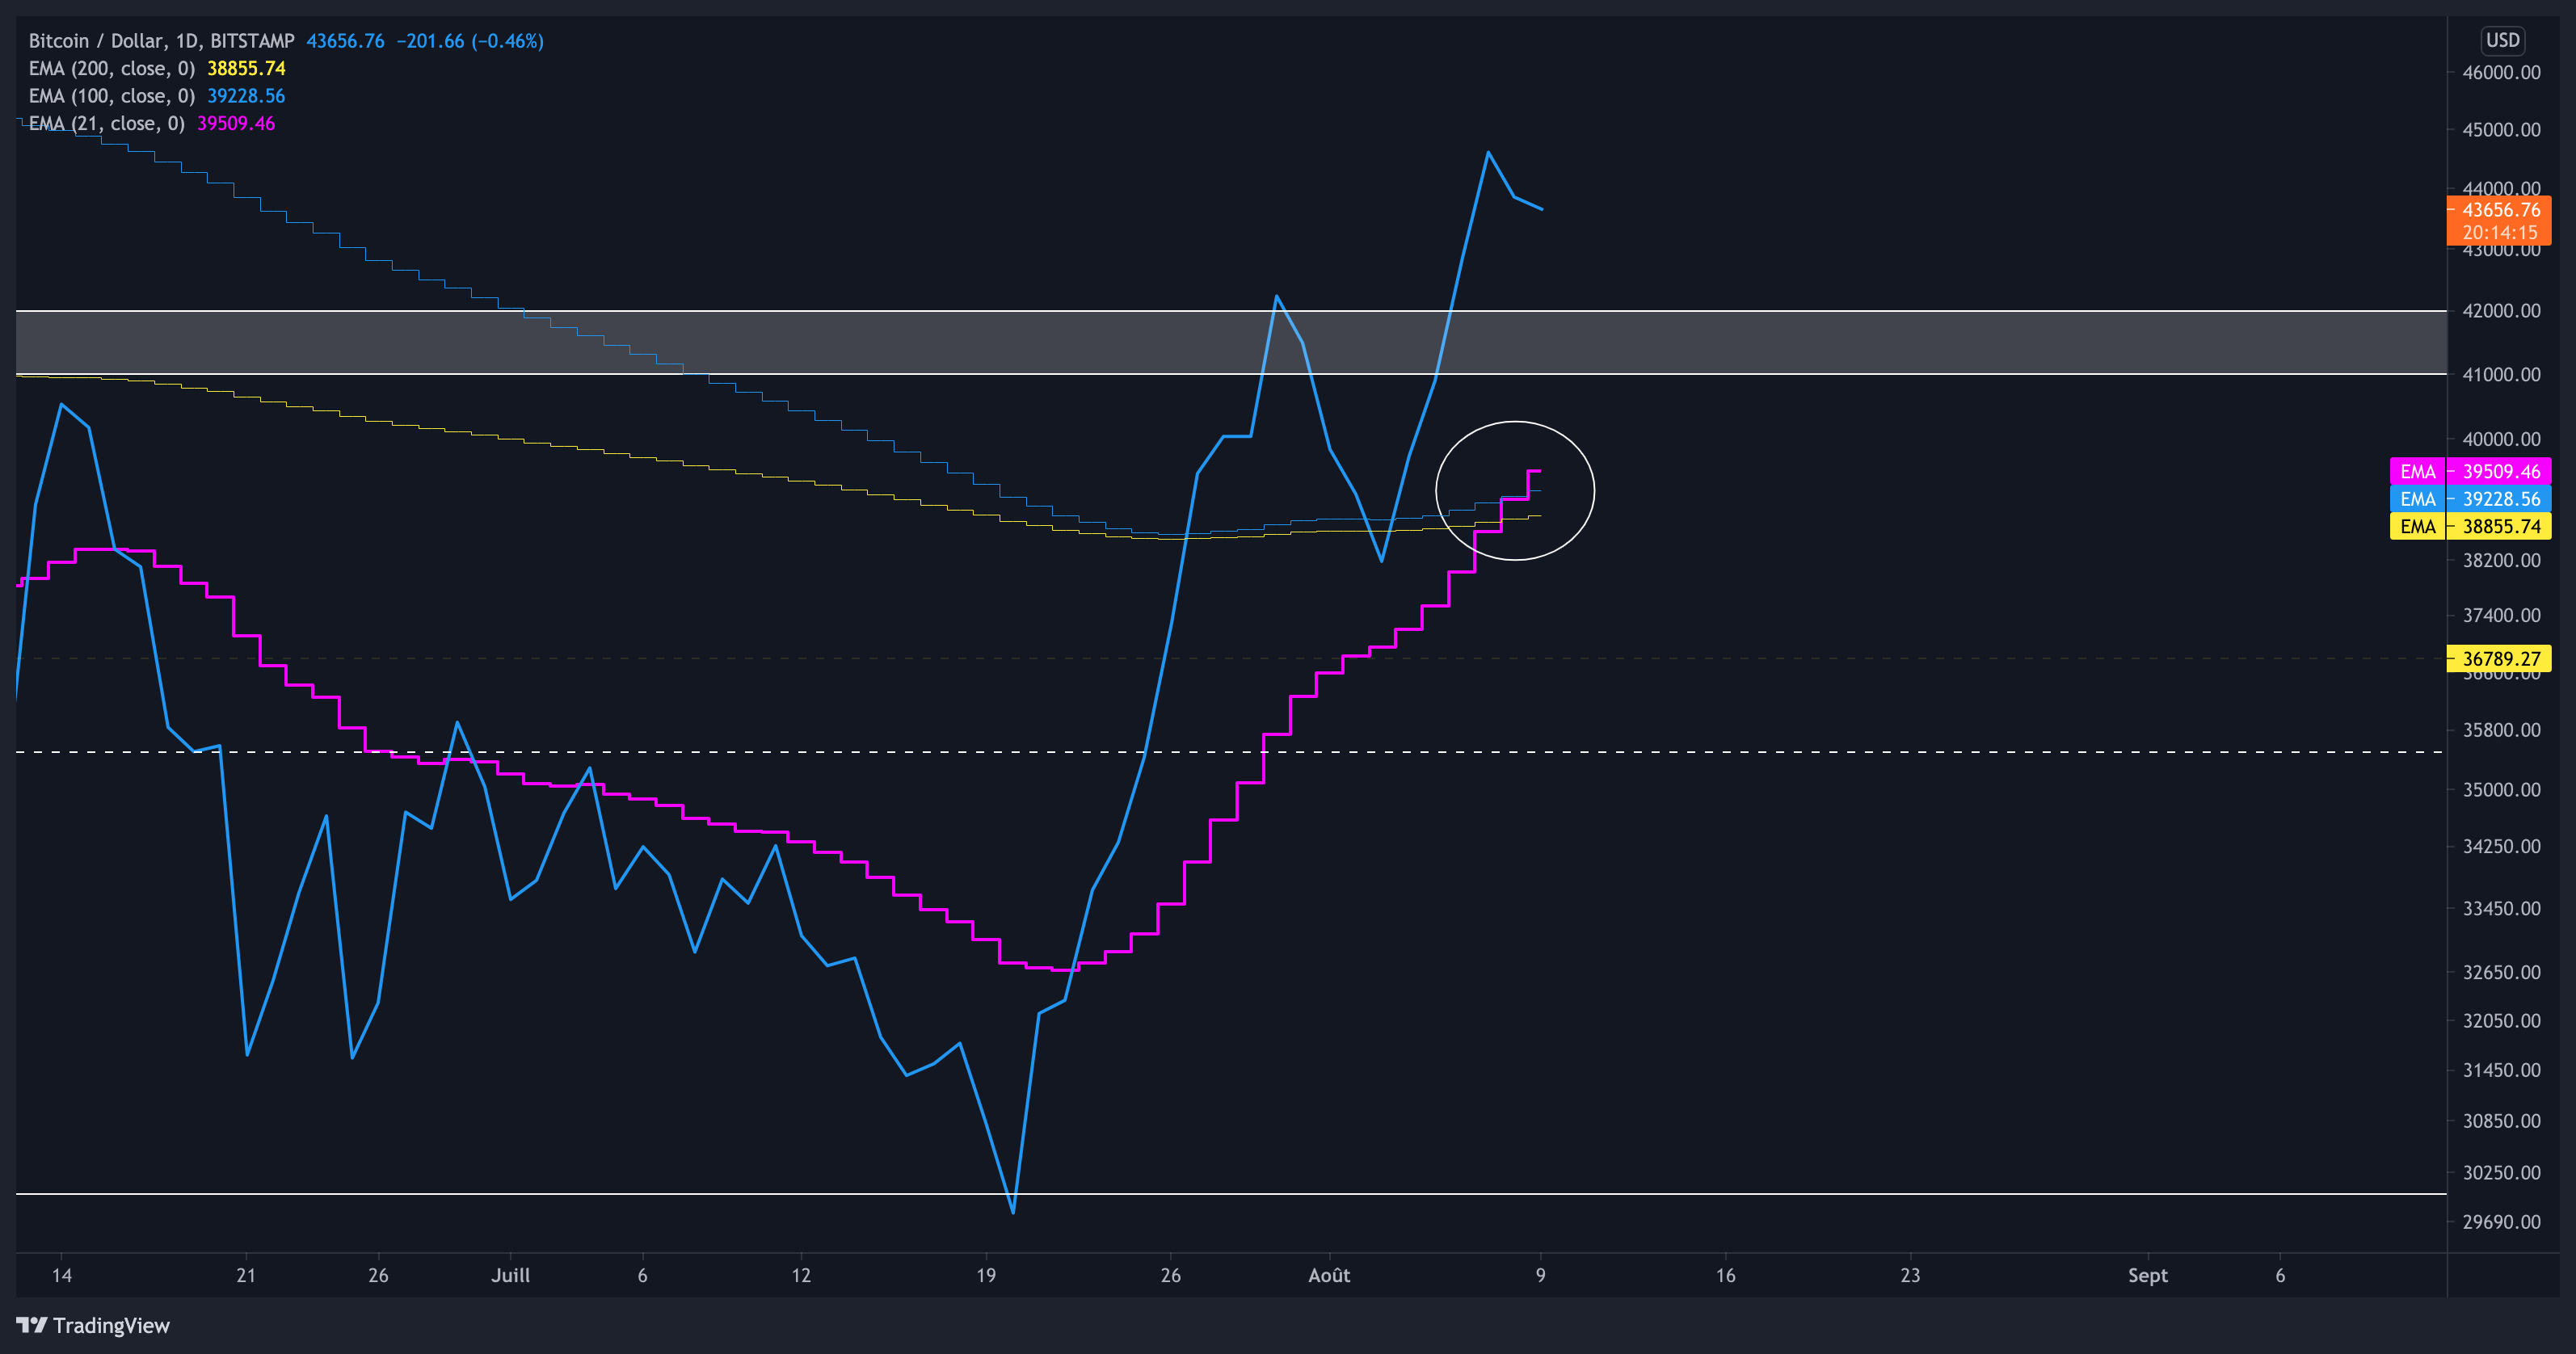
As you can see here, the EMA 21 just crossed both, EMA 100 and EMA 200.
Fibonacci Levels

I say it again, I love Fibonacci retracement. Theses Levels are very accurate in any bounce or pullback.
The 0.618 level ($42,460) was a clear resistance, it’s from this level that Bitcoin pullback to $38,000. Next attempt concluded with a clear breakout and now, Bitcoin is retesting this level as support (holding well right now).
Next resistance according to this Fibonacci retracement should be around $46,700.
Weekly Close
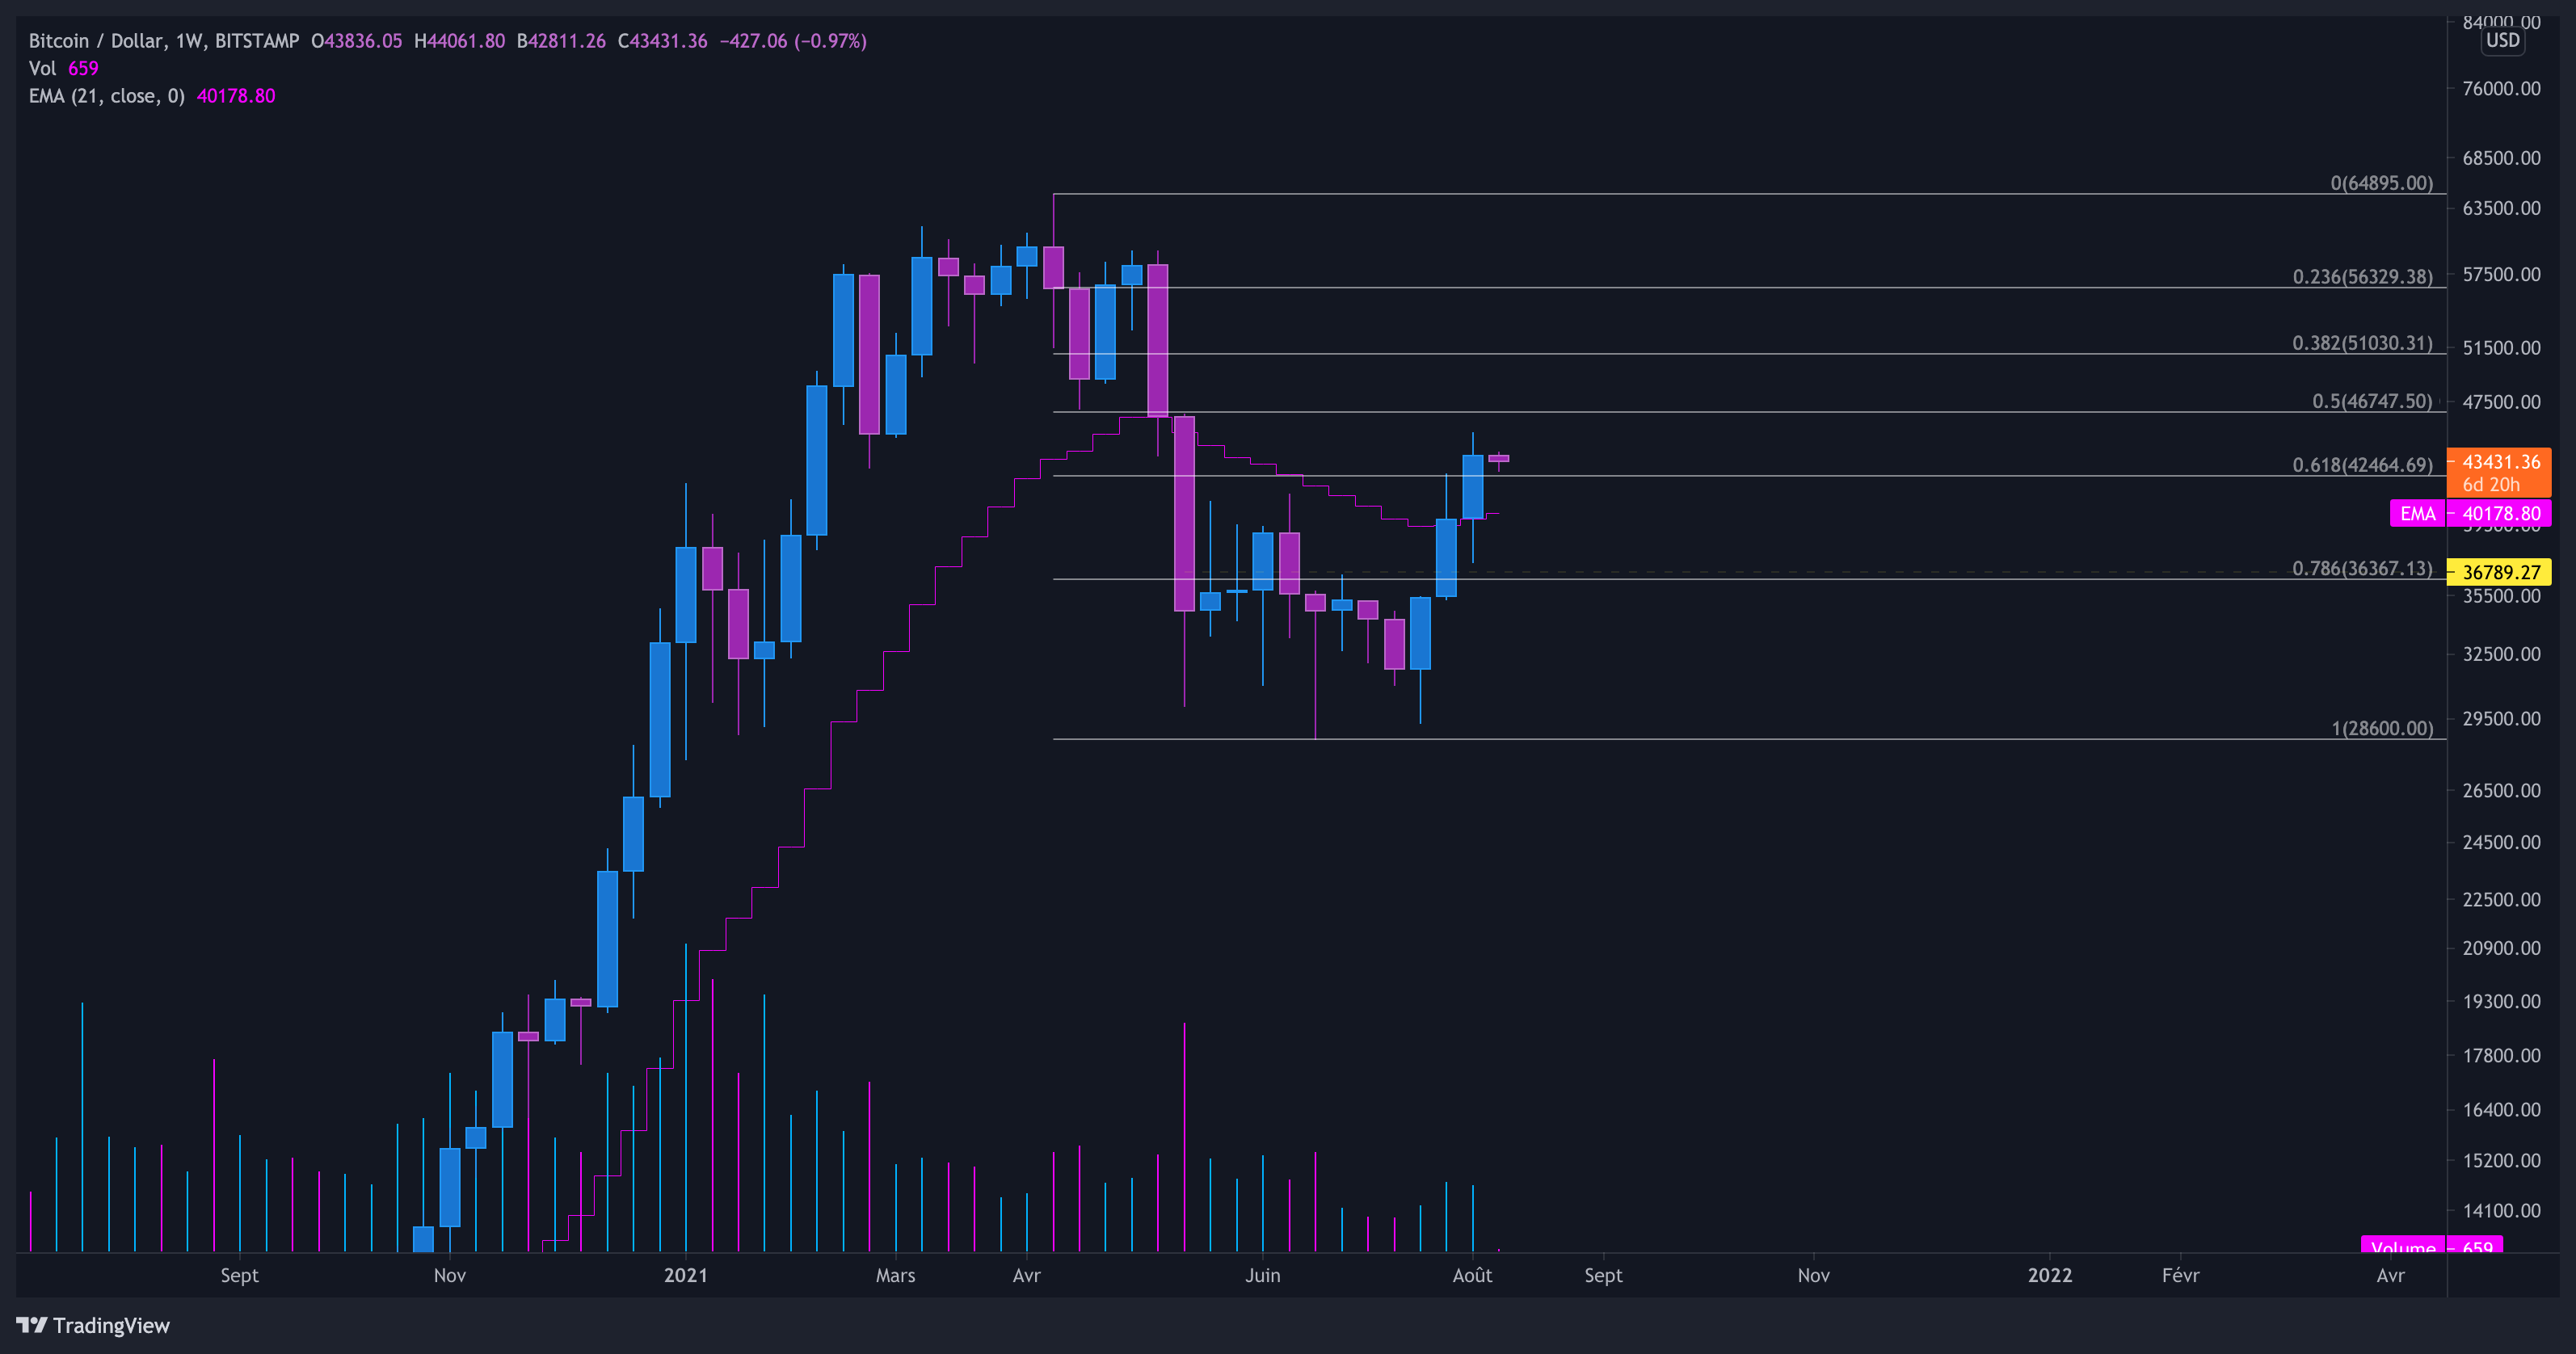
Imo, this weekly close above $42,000 is very bullish because I think it’s a reversal level. As long as bulls can hold the price above, momentum looks good and dips are for buying.
However, a Lower High still could happen around $48,000. That’s mean, bulls did the job for now and have to consolidate the King around theses levels to get a next strong impulse and break last resistances to print a Higher High, otherwise, we could potentially see lower level. Once a potential lower high is ruled out, we can definitely set a new 3-digit target in the coming months.
Weekly Plan
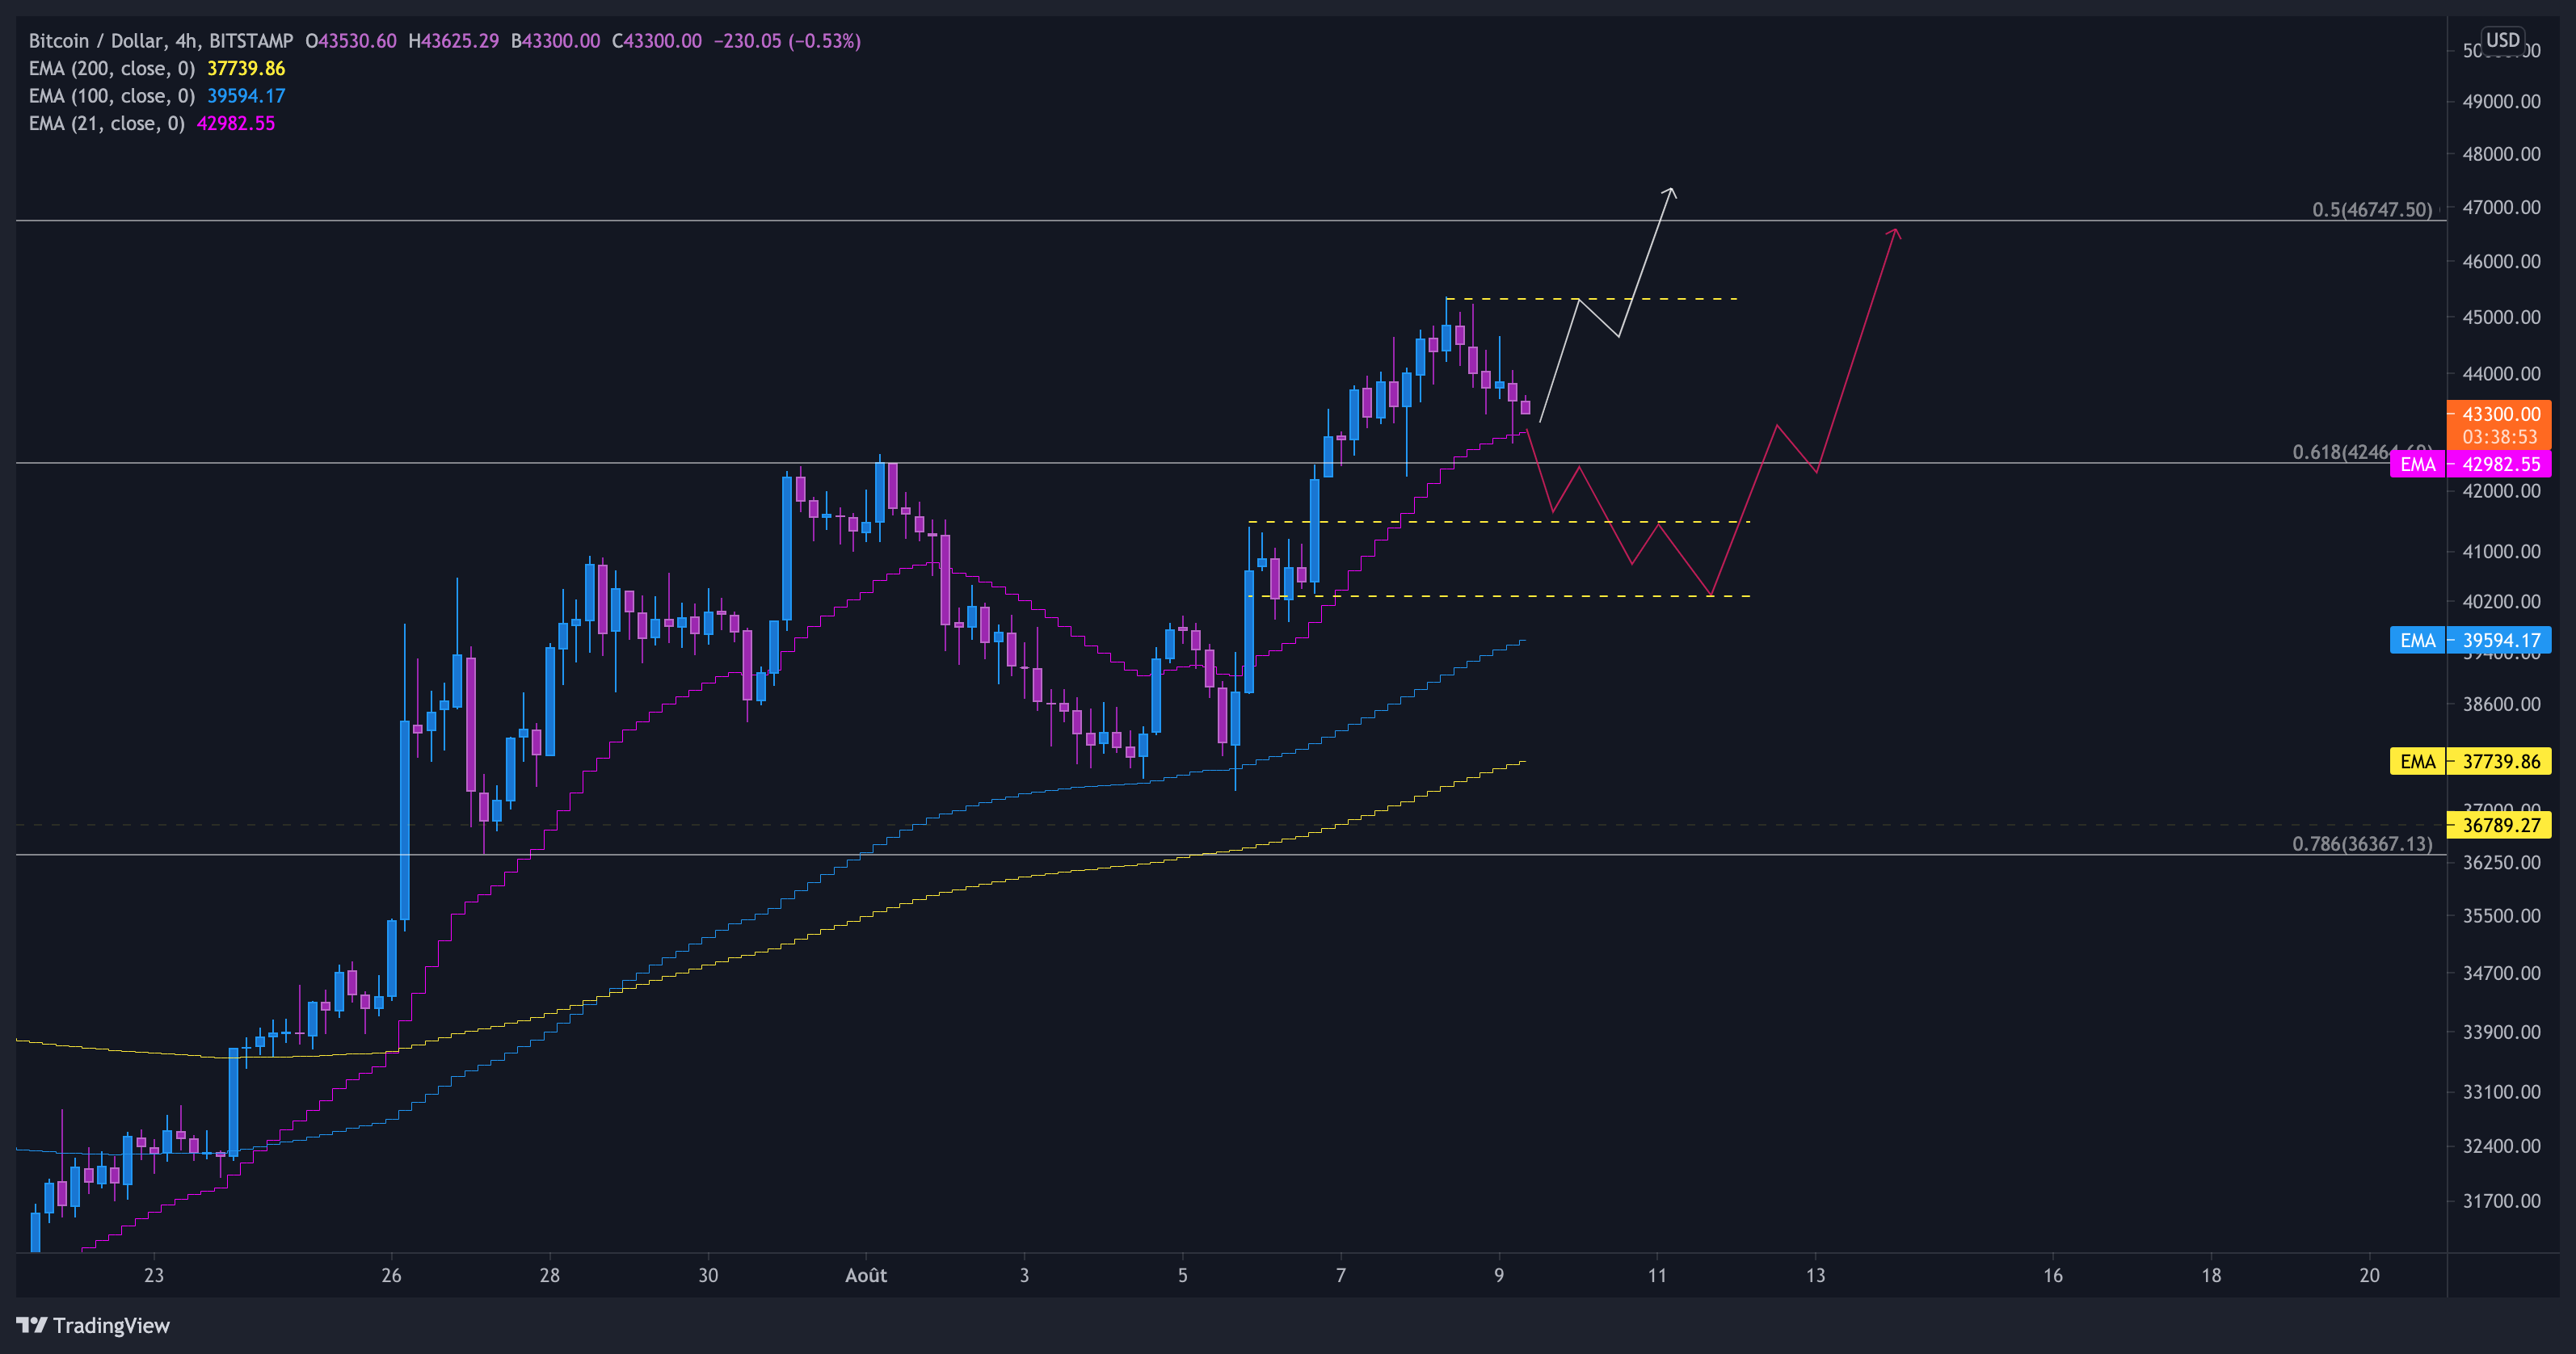
EMA 21 (H4) and 0.618 Fibonacci level should act as local support here. If we lose it, we could revisit $40,500 and retest the previous diagonal resistance we broke out few days ago (see “The Big Picture” below).
The Big Picture
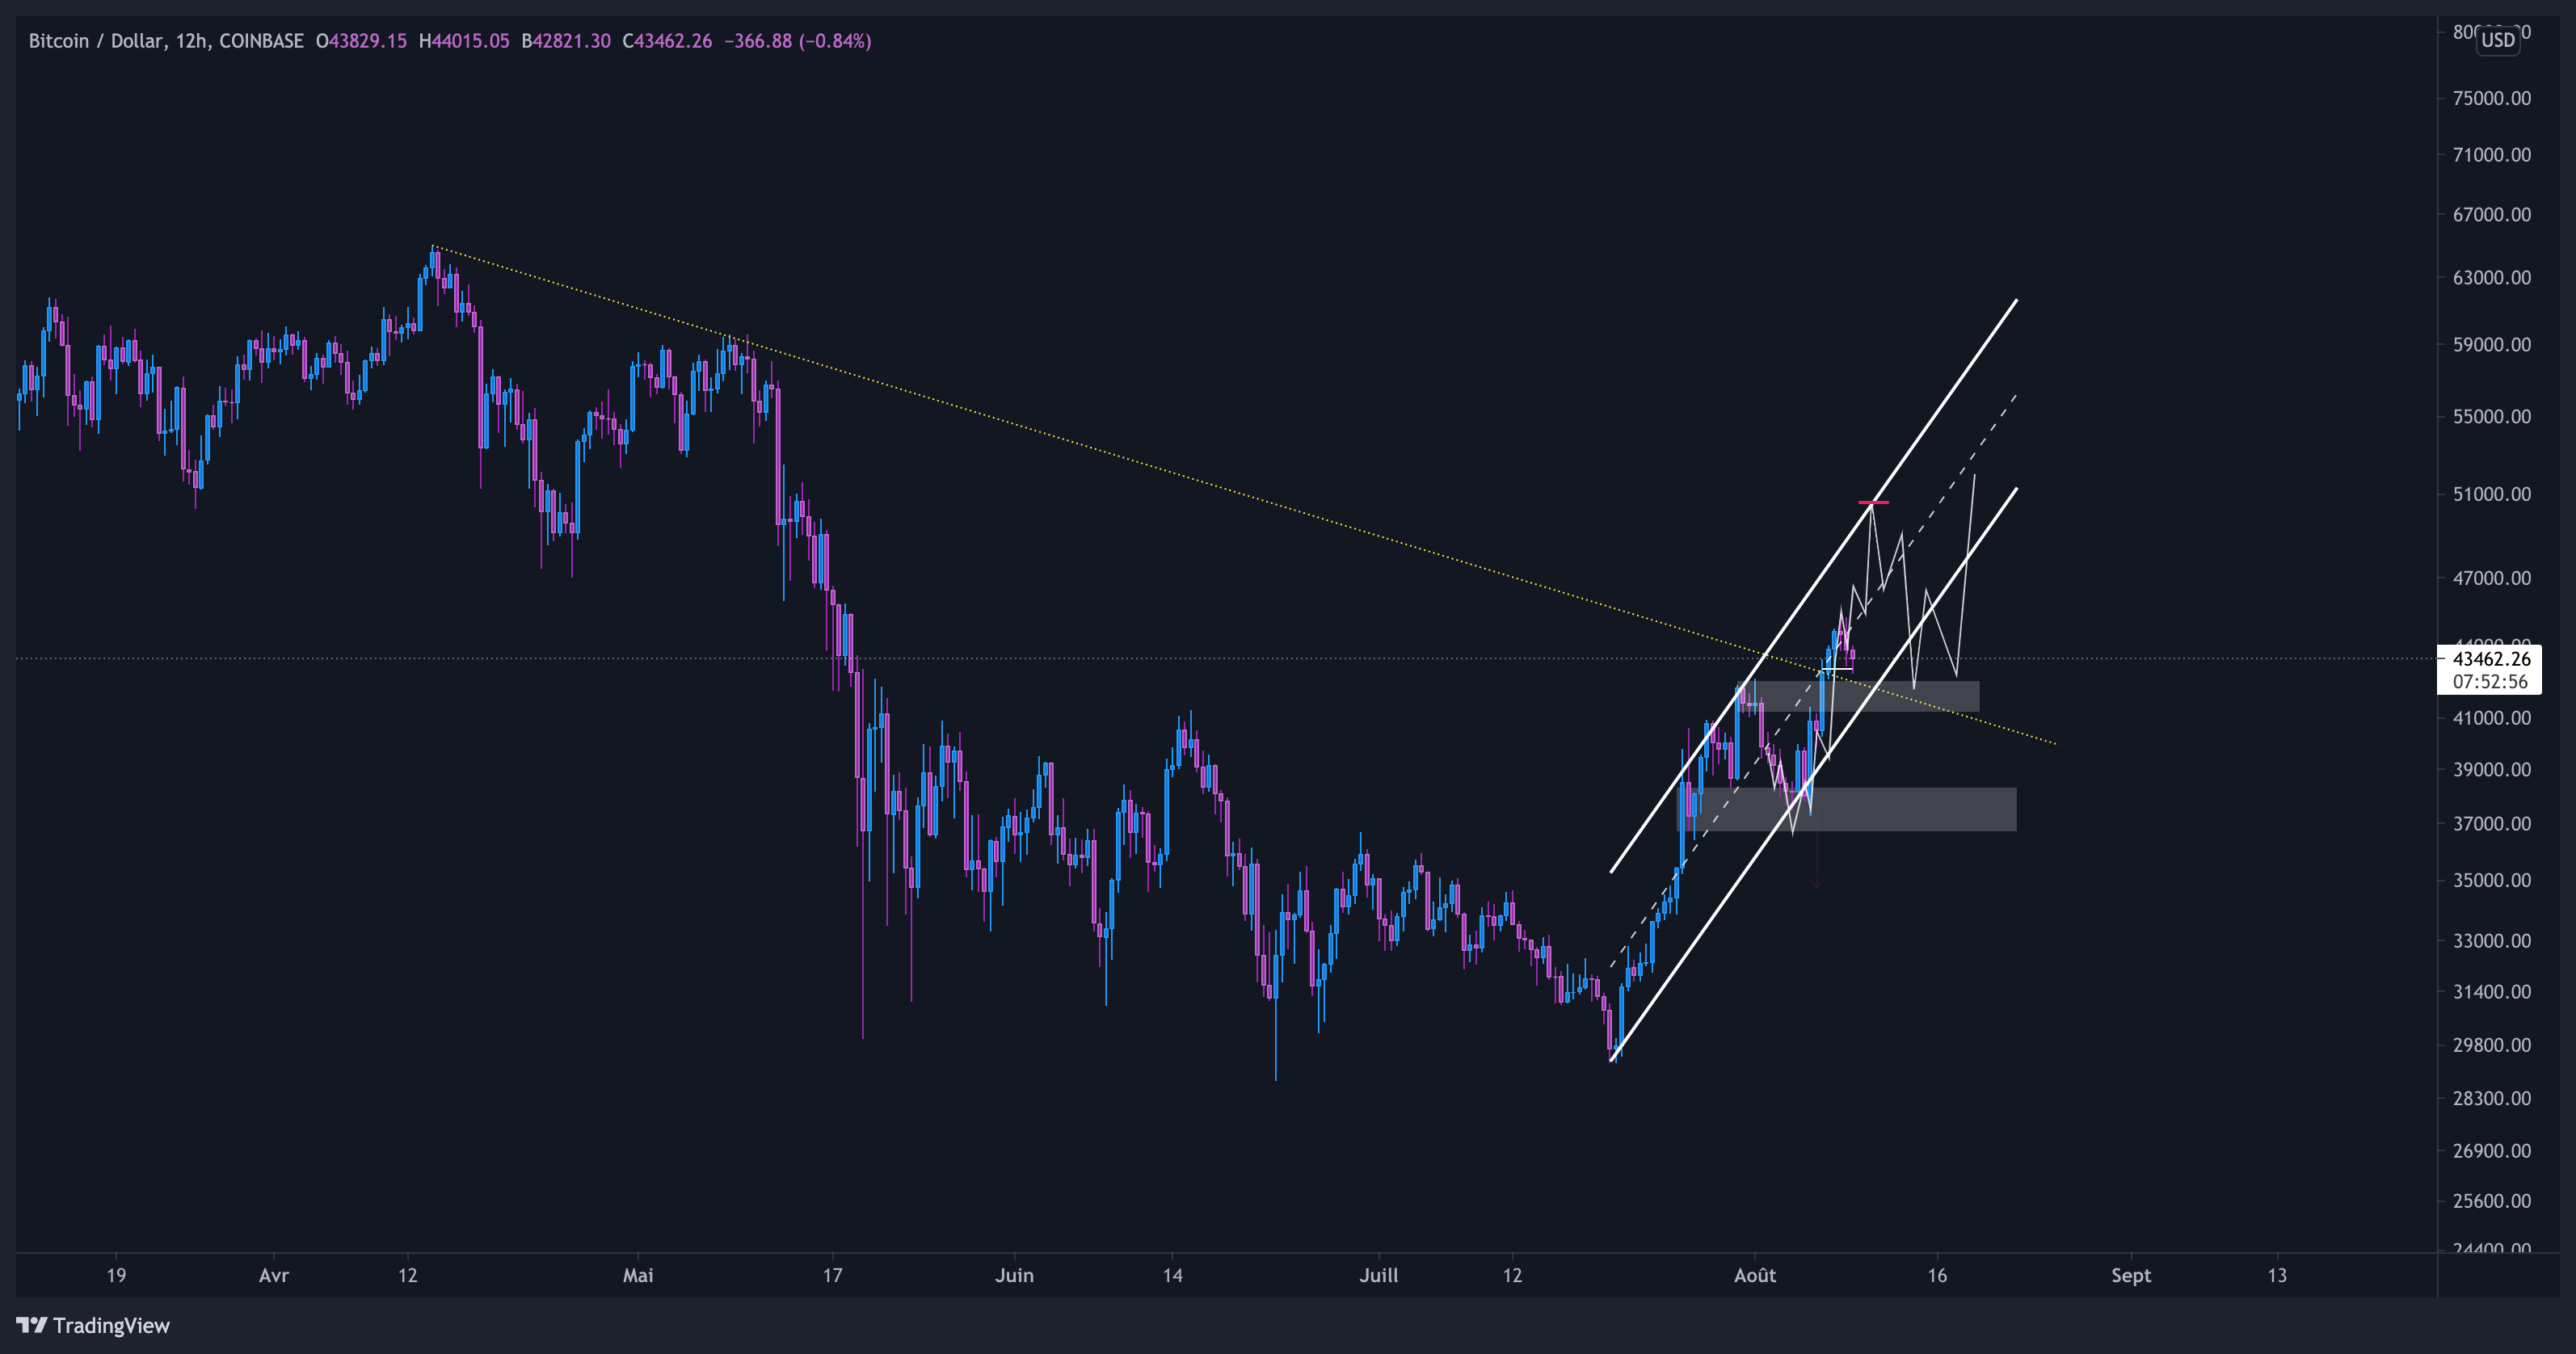
On this zoomed-out chart, we can see a clear breakout from diagonal resistance (drawn from ATH). Bitcoin is not really far to retest it and it could happen early this week.
Overall,
we had beautiful bullish days past week and as you know, nothing goes up in a straight line. Theses pull back are very important to build an healthy trend and reduce the risk of a big market dump. Play the king level by level.
If you like it, don’t forget to subscribe, share and follow theses account on Twitter: @AnthoXBT & @ApeBaguette