

Ocean Technical Analysis Update - Week 32
Ocean Technical Analysis Update - Week 32
Ocean Protocol reclaimed its daily EMA 100 and weekly support! Are you bearish? You are wrong.

We just opened a Discord channel to discuss cryptos! Join us now: anthoxbt.com/join
Summary
Previous Analysis
EMA 100 (Daily) Breakout
Fibonacci Levels
VPVR & POC
Weekly Support Reclaimed
Weekly Plan
6.1 First scenario
6.2 Second scenarioBTC Pair
Overall
Give Away
Previous Analysis

In my last technical analysis on Ocean, I mentioned the $0.50 psychological level to break, and to be honest many happened since this technical analysis! Not only did OCEAN break $0.5 but also broke the $0.6 and seems to have flipped it into support!
Well, so far so good, OCEAN has doubled its value in less than a month since its bottom around $0.34.
EMA 100 (Daily) Breakout

Finally! OCEAN broke its EMA / MA 100 on the daily time frame. After three attempts in the past week, bulls managed to close the last daily candle above $0.66 and therefore by definition above the EMA and MA 100 which were around $0.62-0.63. This is important breakout for further bullish continuation.
Now, the next step is to flip theses EMA / MA 100 and $0.6 level as support and consolidate below $0.70 to achieve a next breakout.
Fibonacci Levels
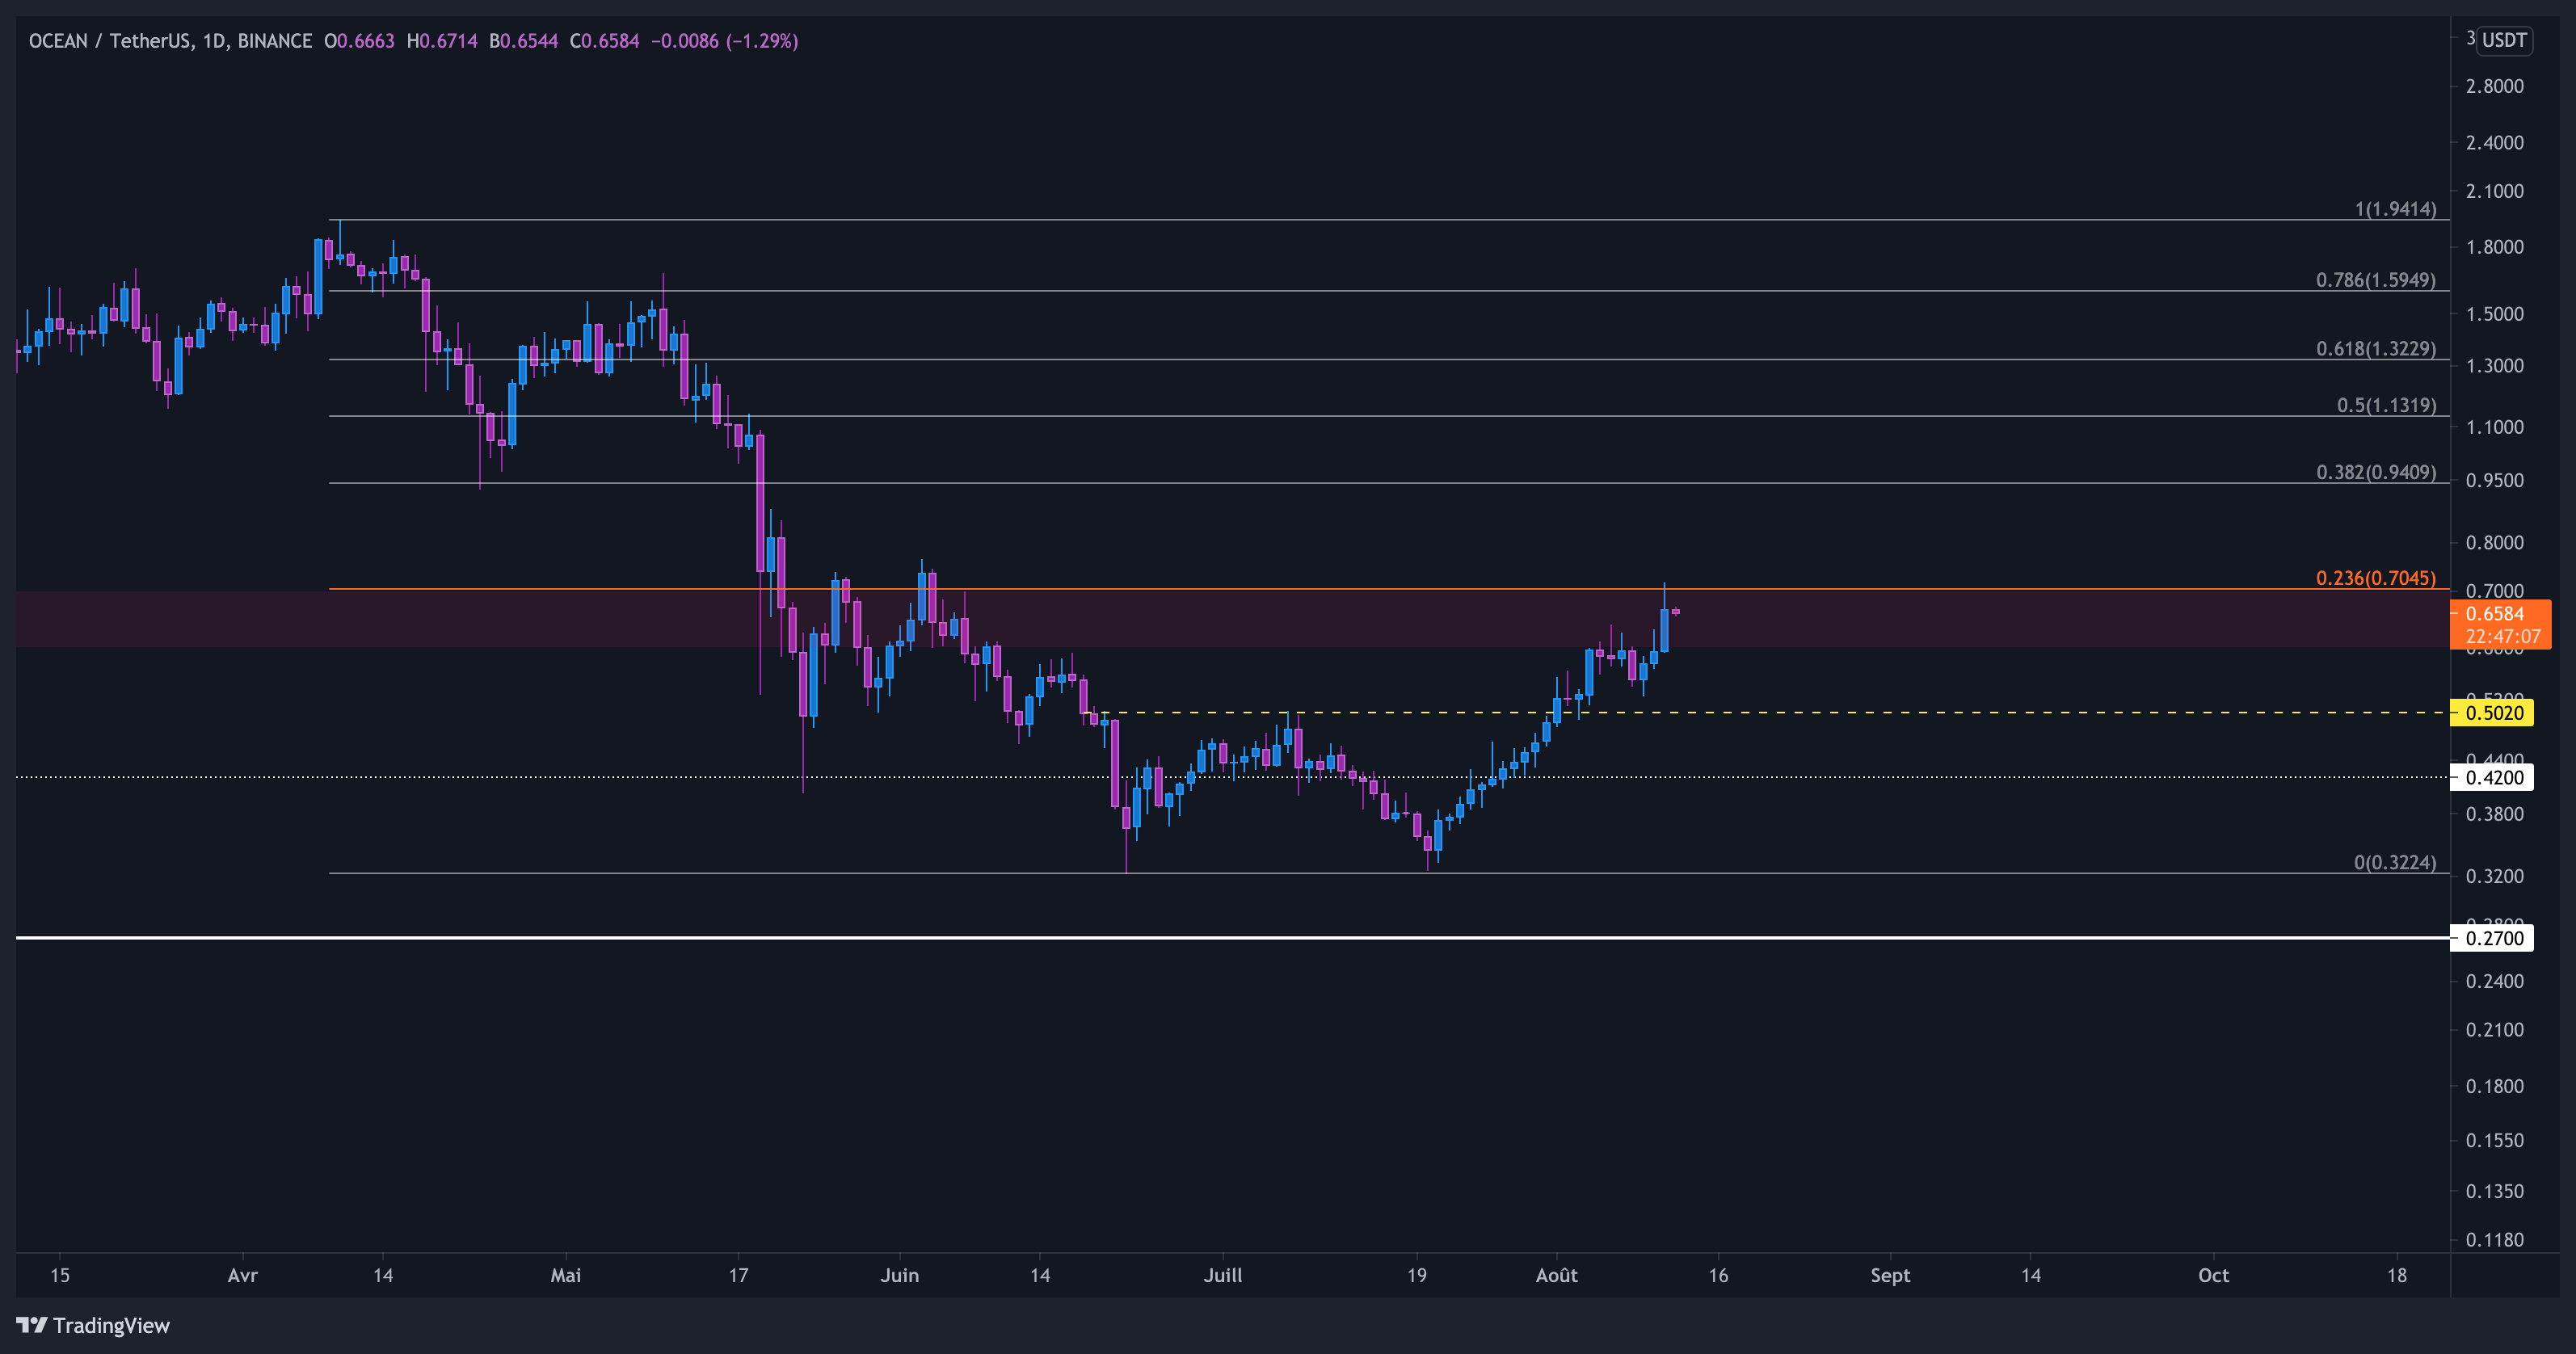
It's hard not to like the accuracy of Fibonacci levels, isn't it? Looks at how the 0.236 level (orange line) reacted as resistance here. This is the next key level to break before $1, even maybe the biggest one as there is no many resistance area between $0.7 and $1.
VPVR & POC

The good news and why I love this chart right now is that even if OCEAN pull back to $0.55, it’ll remain bullish! Have a look at the red-dotted line, the POC (Point Of Control). This is the new local strong support! To be honest, keep it simple here, each dip above this level is a buy. To lose this momentum, a daily close would have to be below this level.
Weekly Support Reclaimed
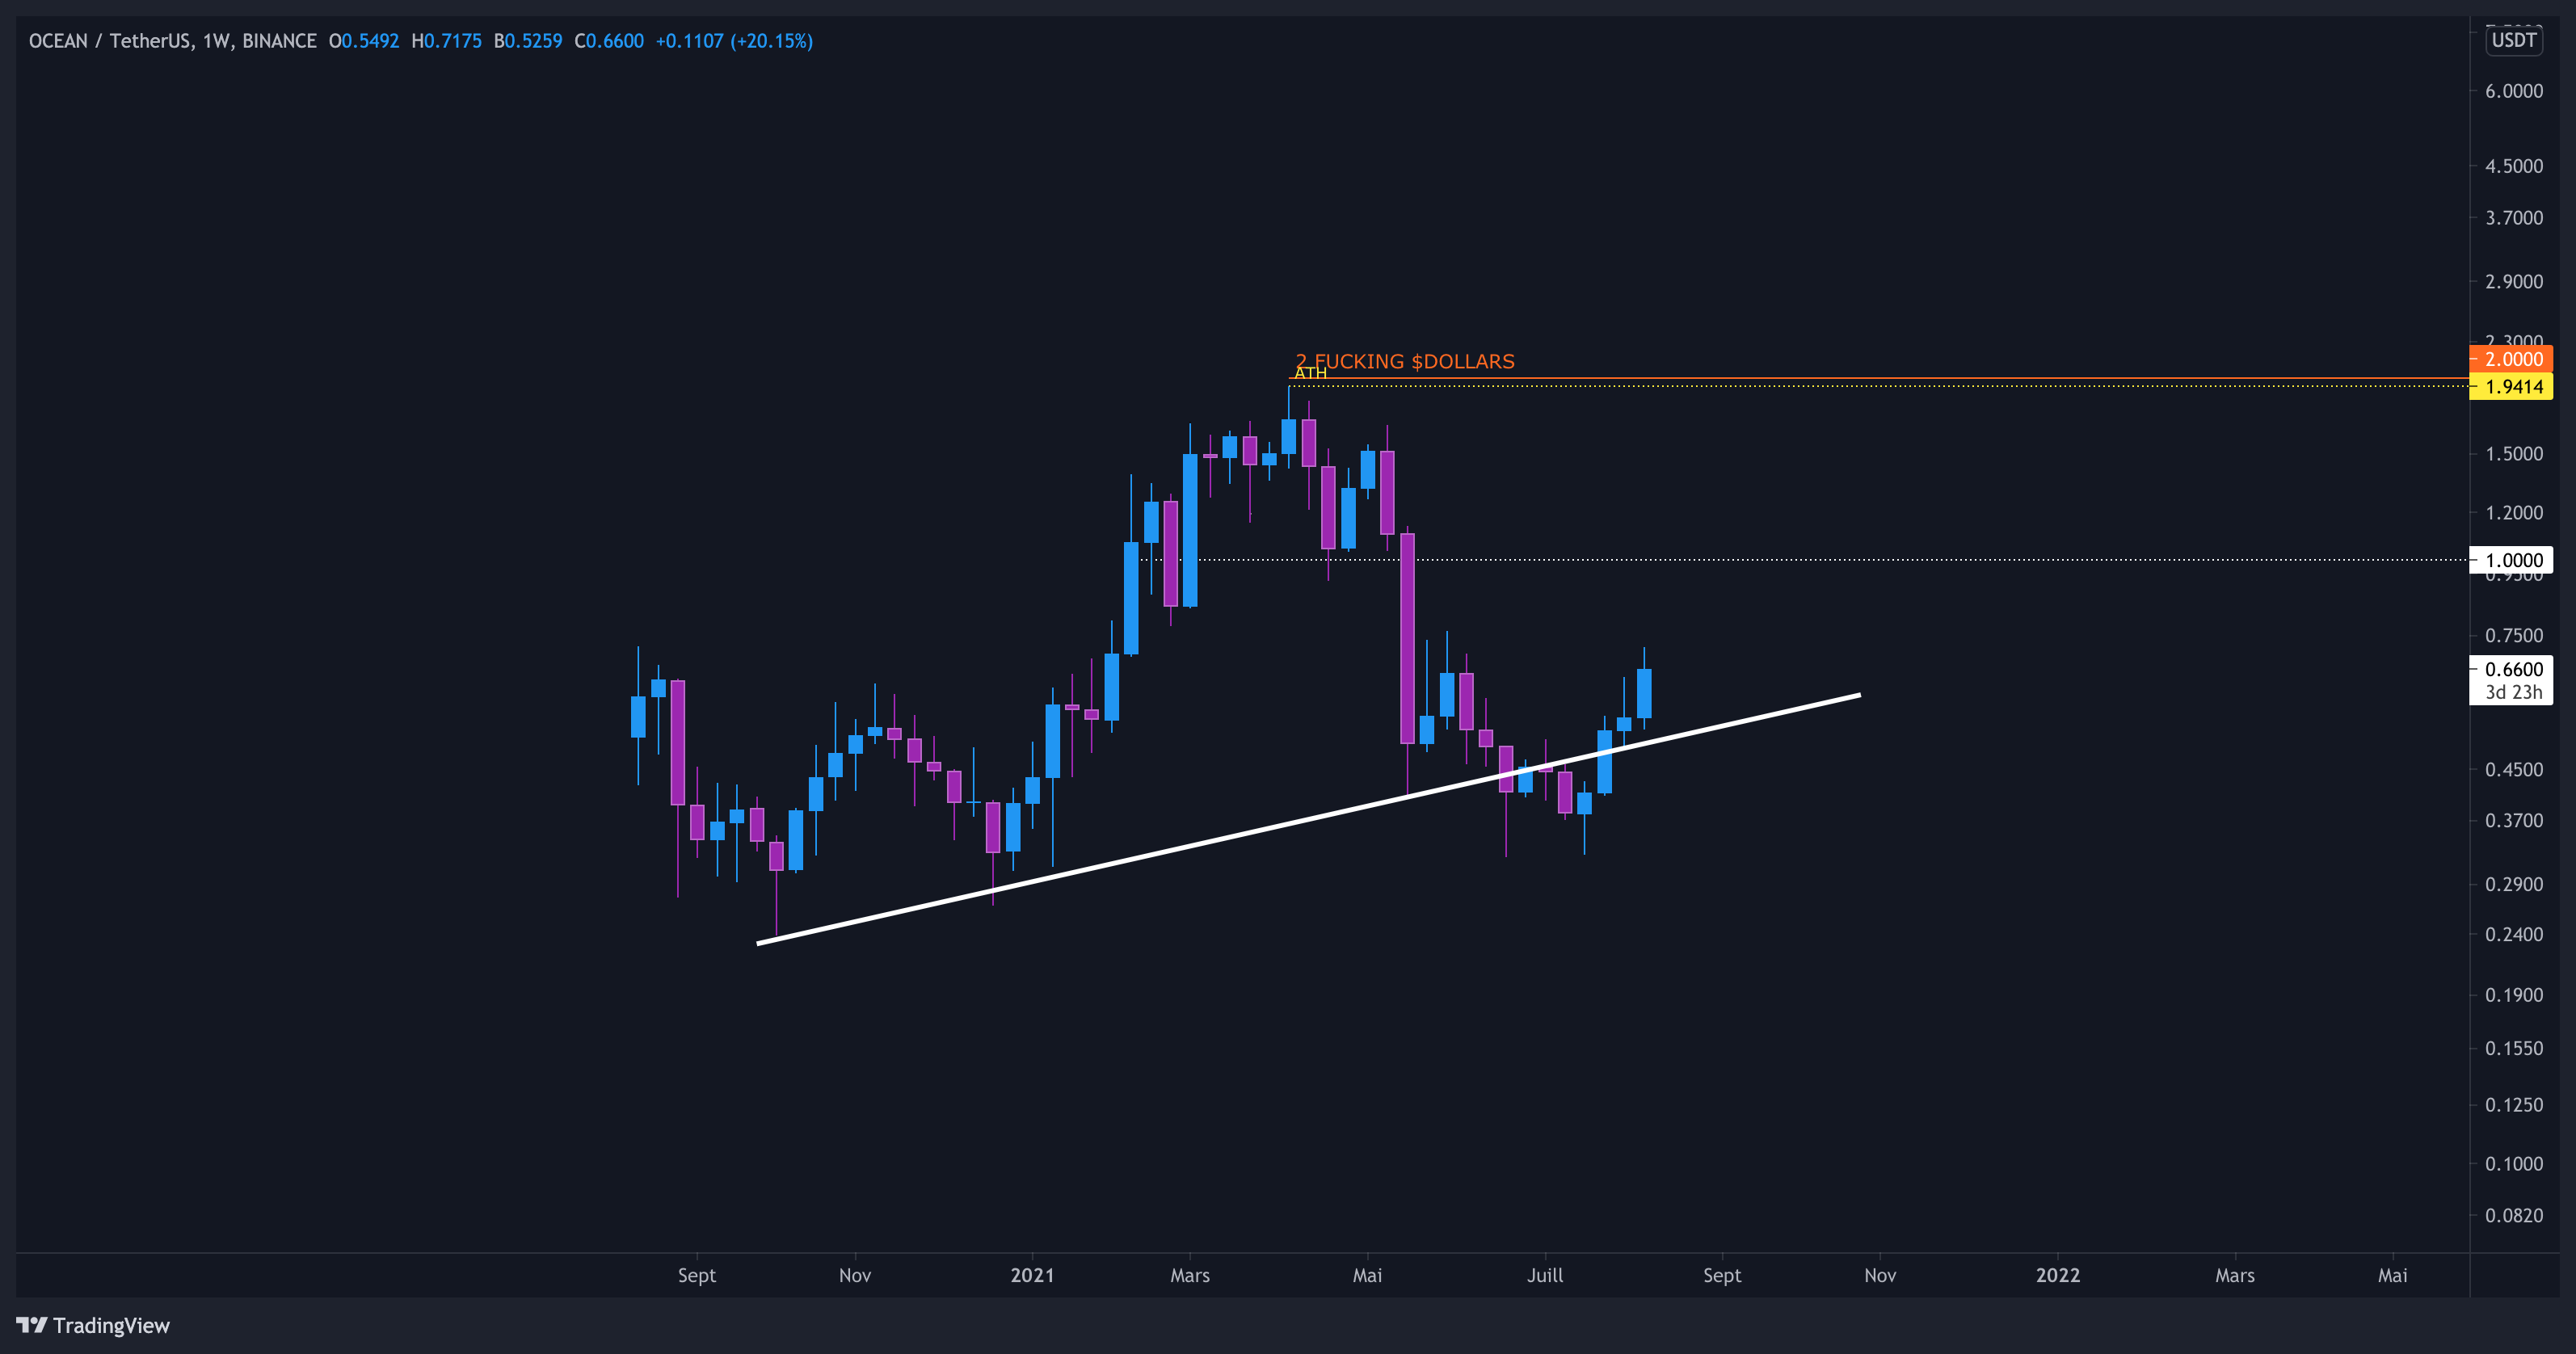
Yes! OCEAN finally reclaimed its weekly support! This is a very good news because previous weekly candle retested it with success and it’s also confirm a deviation instead of a break down!
If you’re still not bullish while you see this weekly chart, then I don’t know what to say…
Weekly Plan

There are the scenarios I have in my mind for the coming days.
First scenario:
Pull back to EMA 100 (D) / $0.6 level
Bounce from there and break 0.236 fib level ($0.7)
Flip it as support for continuation toward $1
Second scenario:
EMA 100 (D) / $0.6 levels failed as support + bearish retest
Pullback near $0.5-$0.55 (POC see above)
Strong bounce to reclaim $0.6 and EMA 100 (D)
BTC Pair
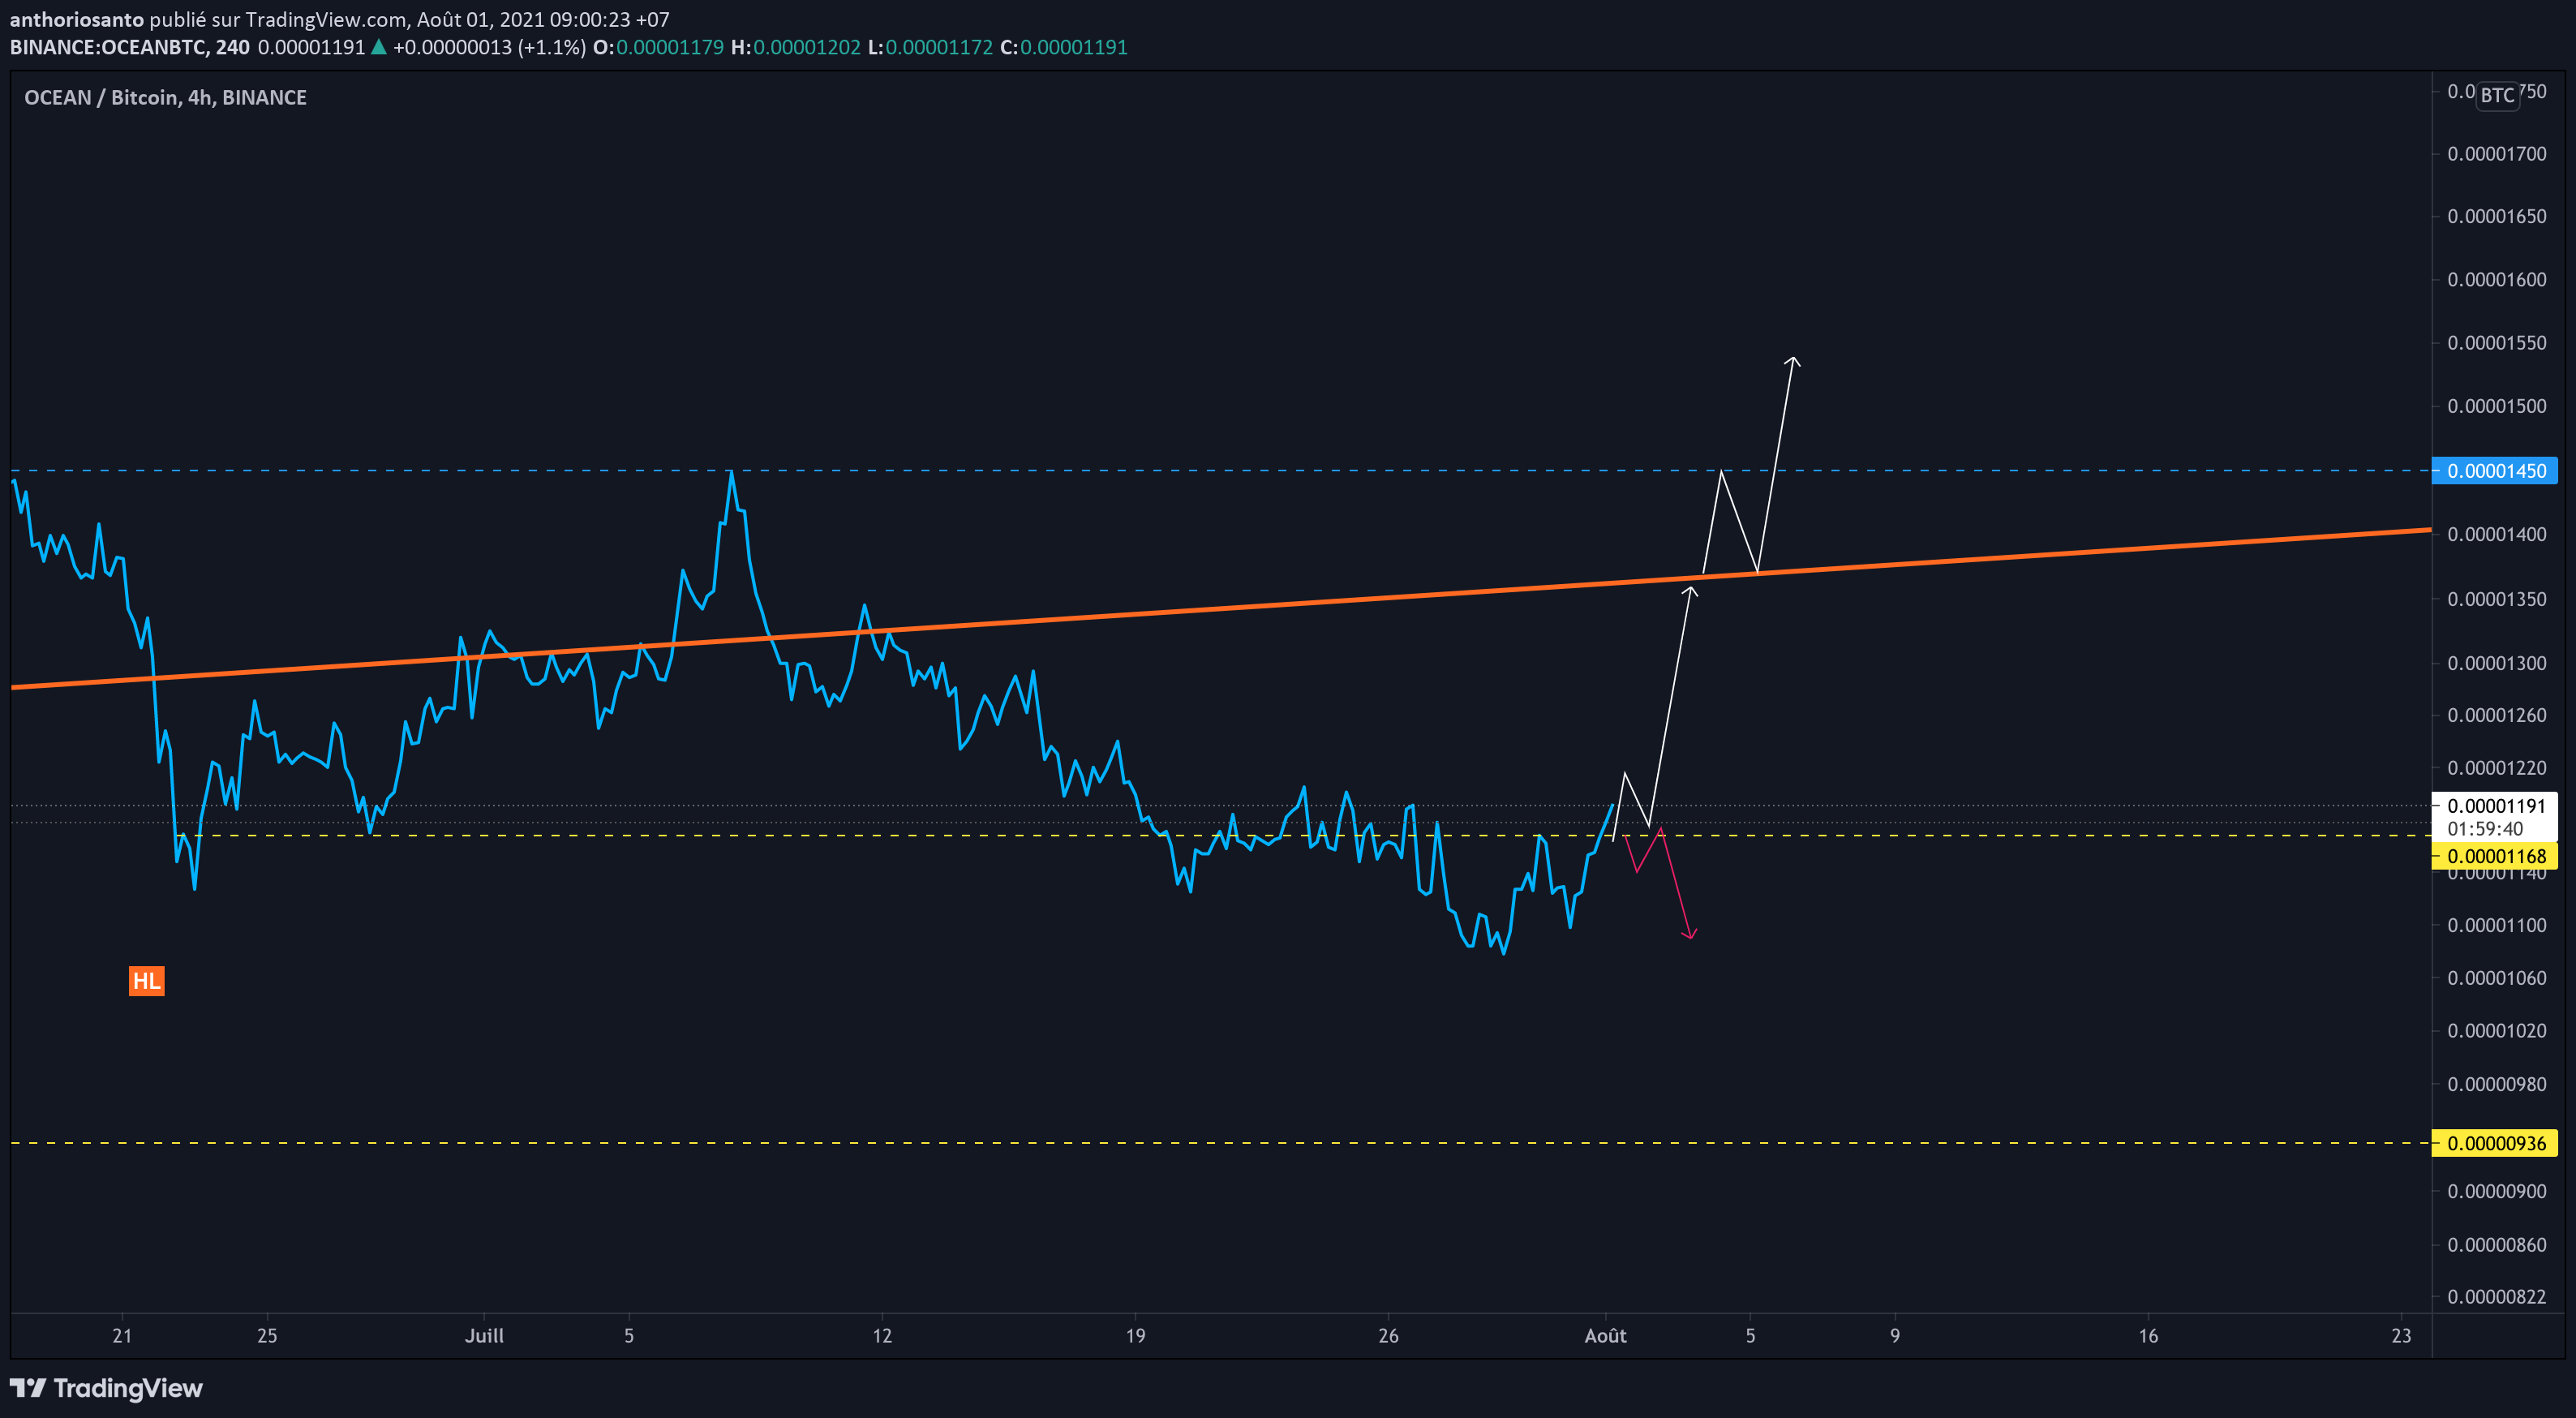
This is the previous BTC Pair chart I shared with you. So far so good, OCEAN followed this path perfectly! Have a look:
Indeed, OCEAN found resistance around 1550 sats and the last Bitcoin pump sent it back around 1250 sats which is the new local support.
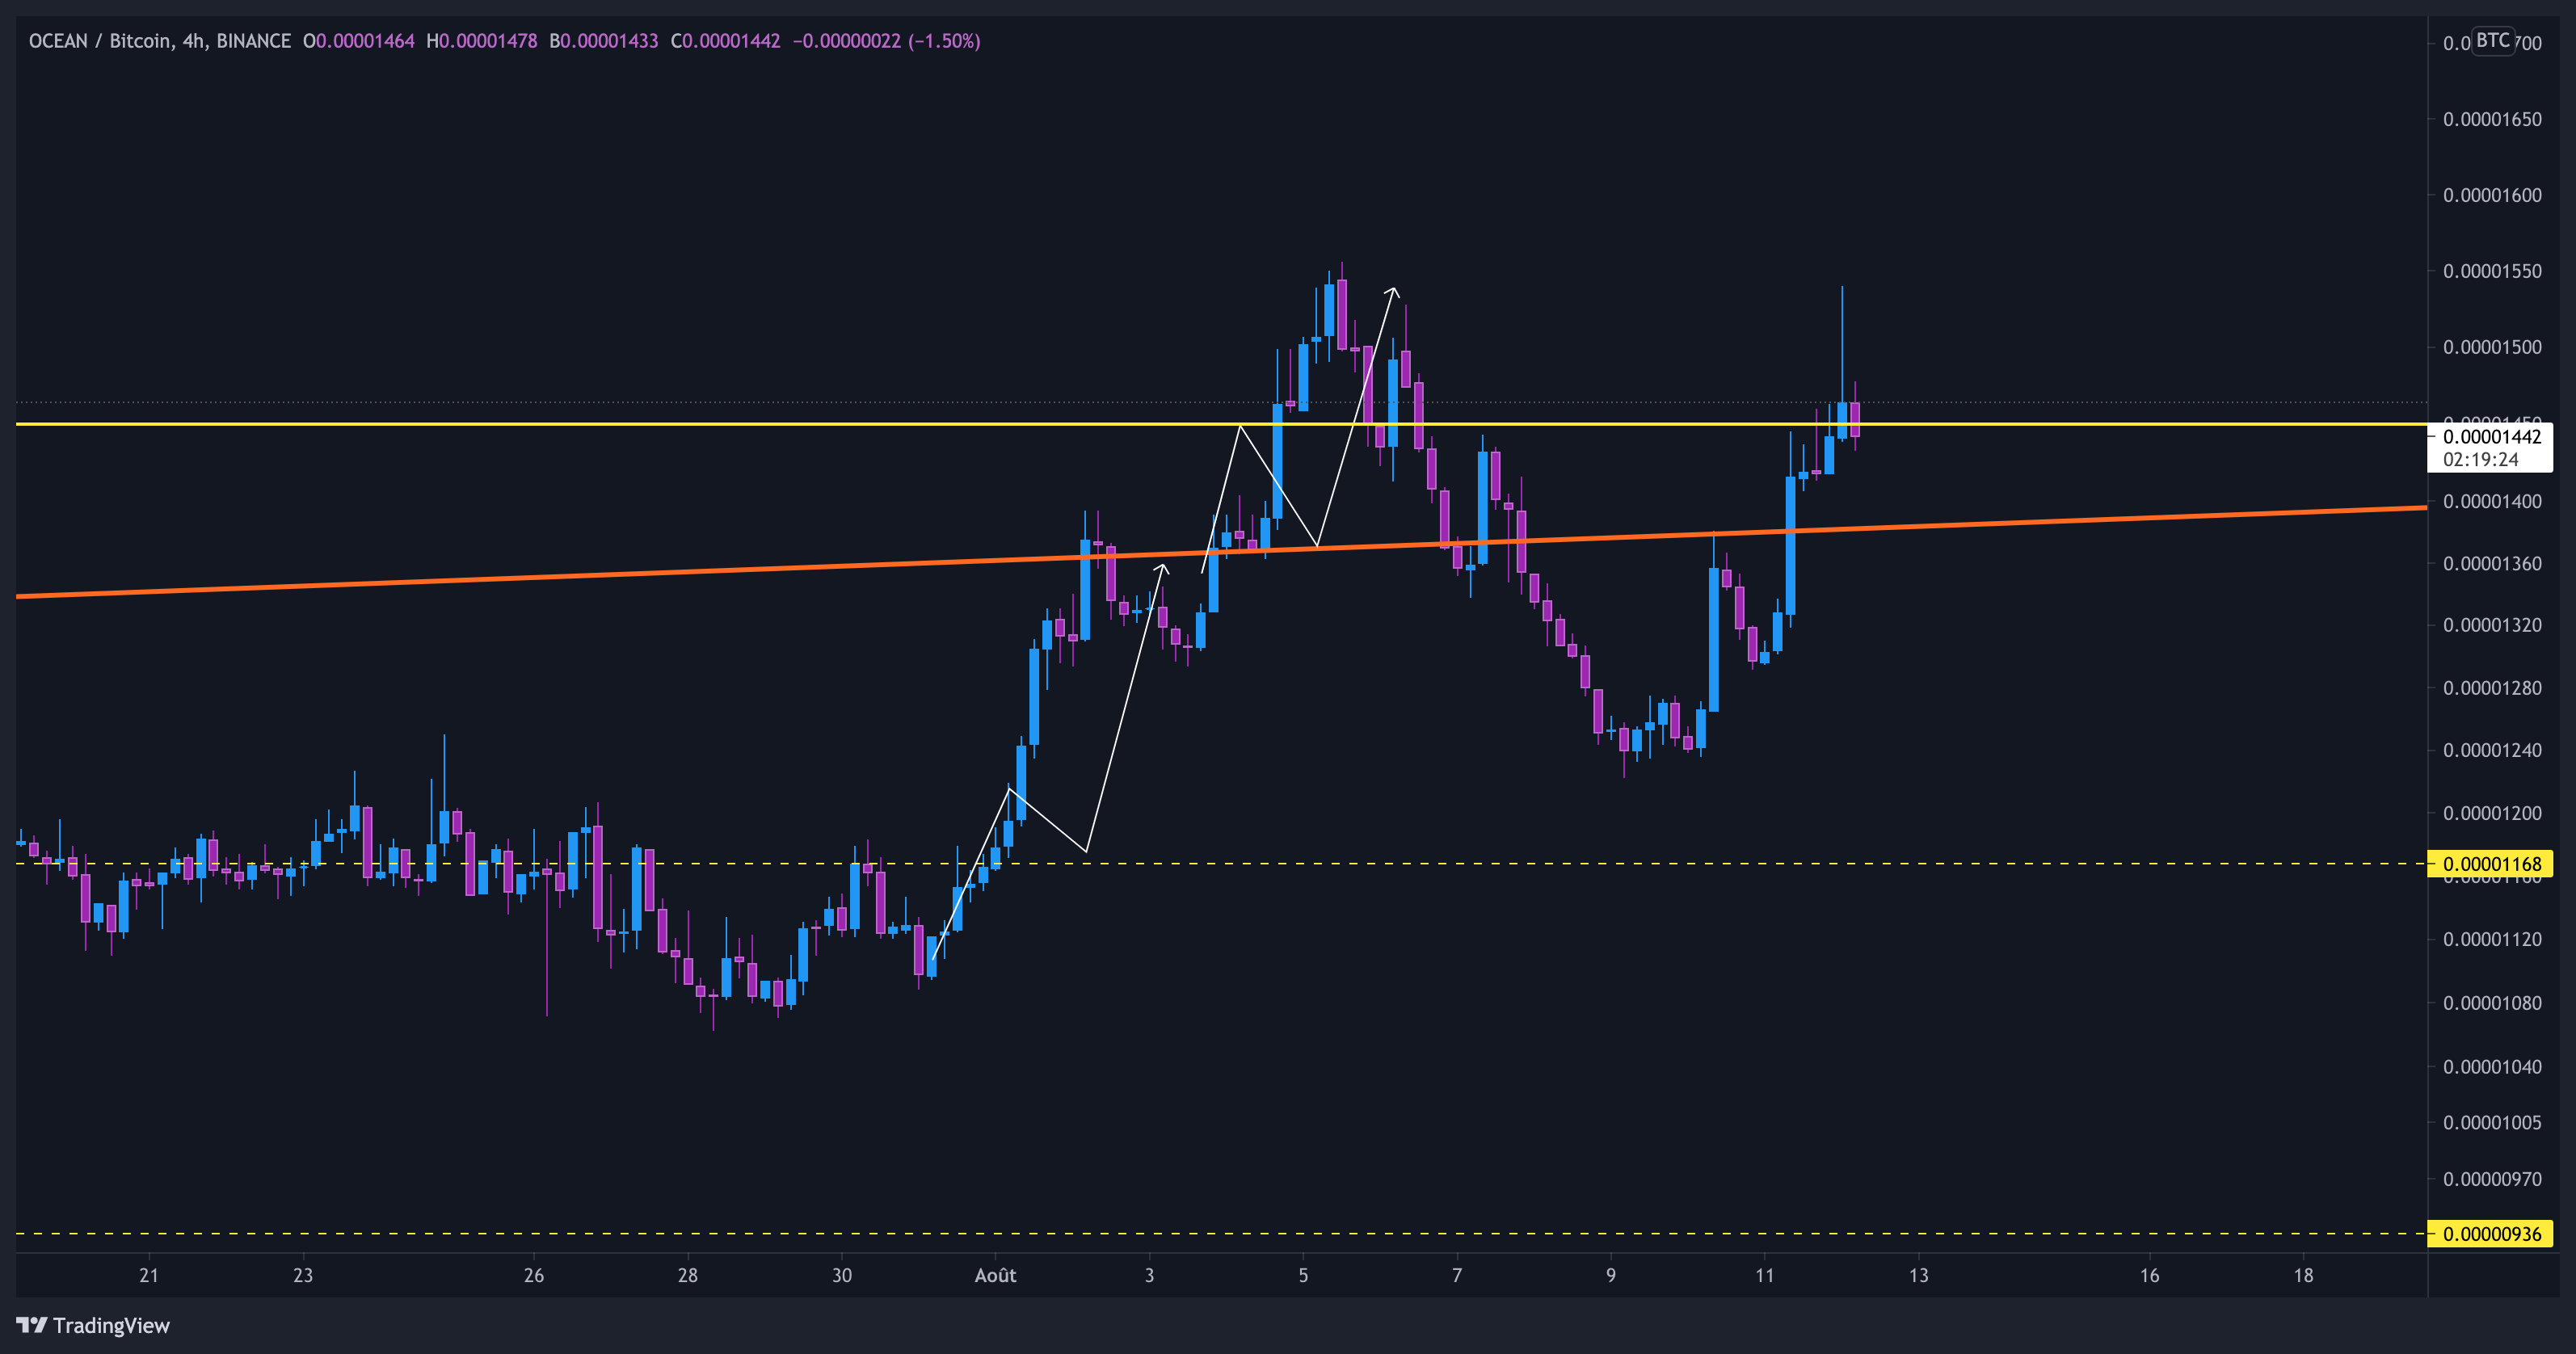
So now, OCEAN/BTC is trying to break a key resistance at 1550 sats. If you are wondering why this level is so important, look at this chart:
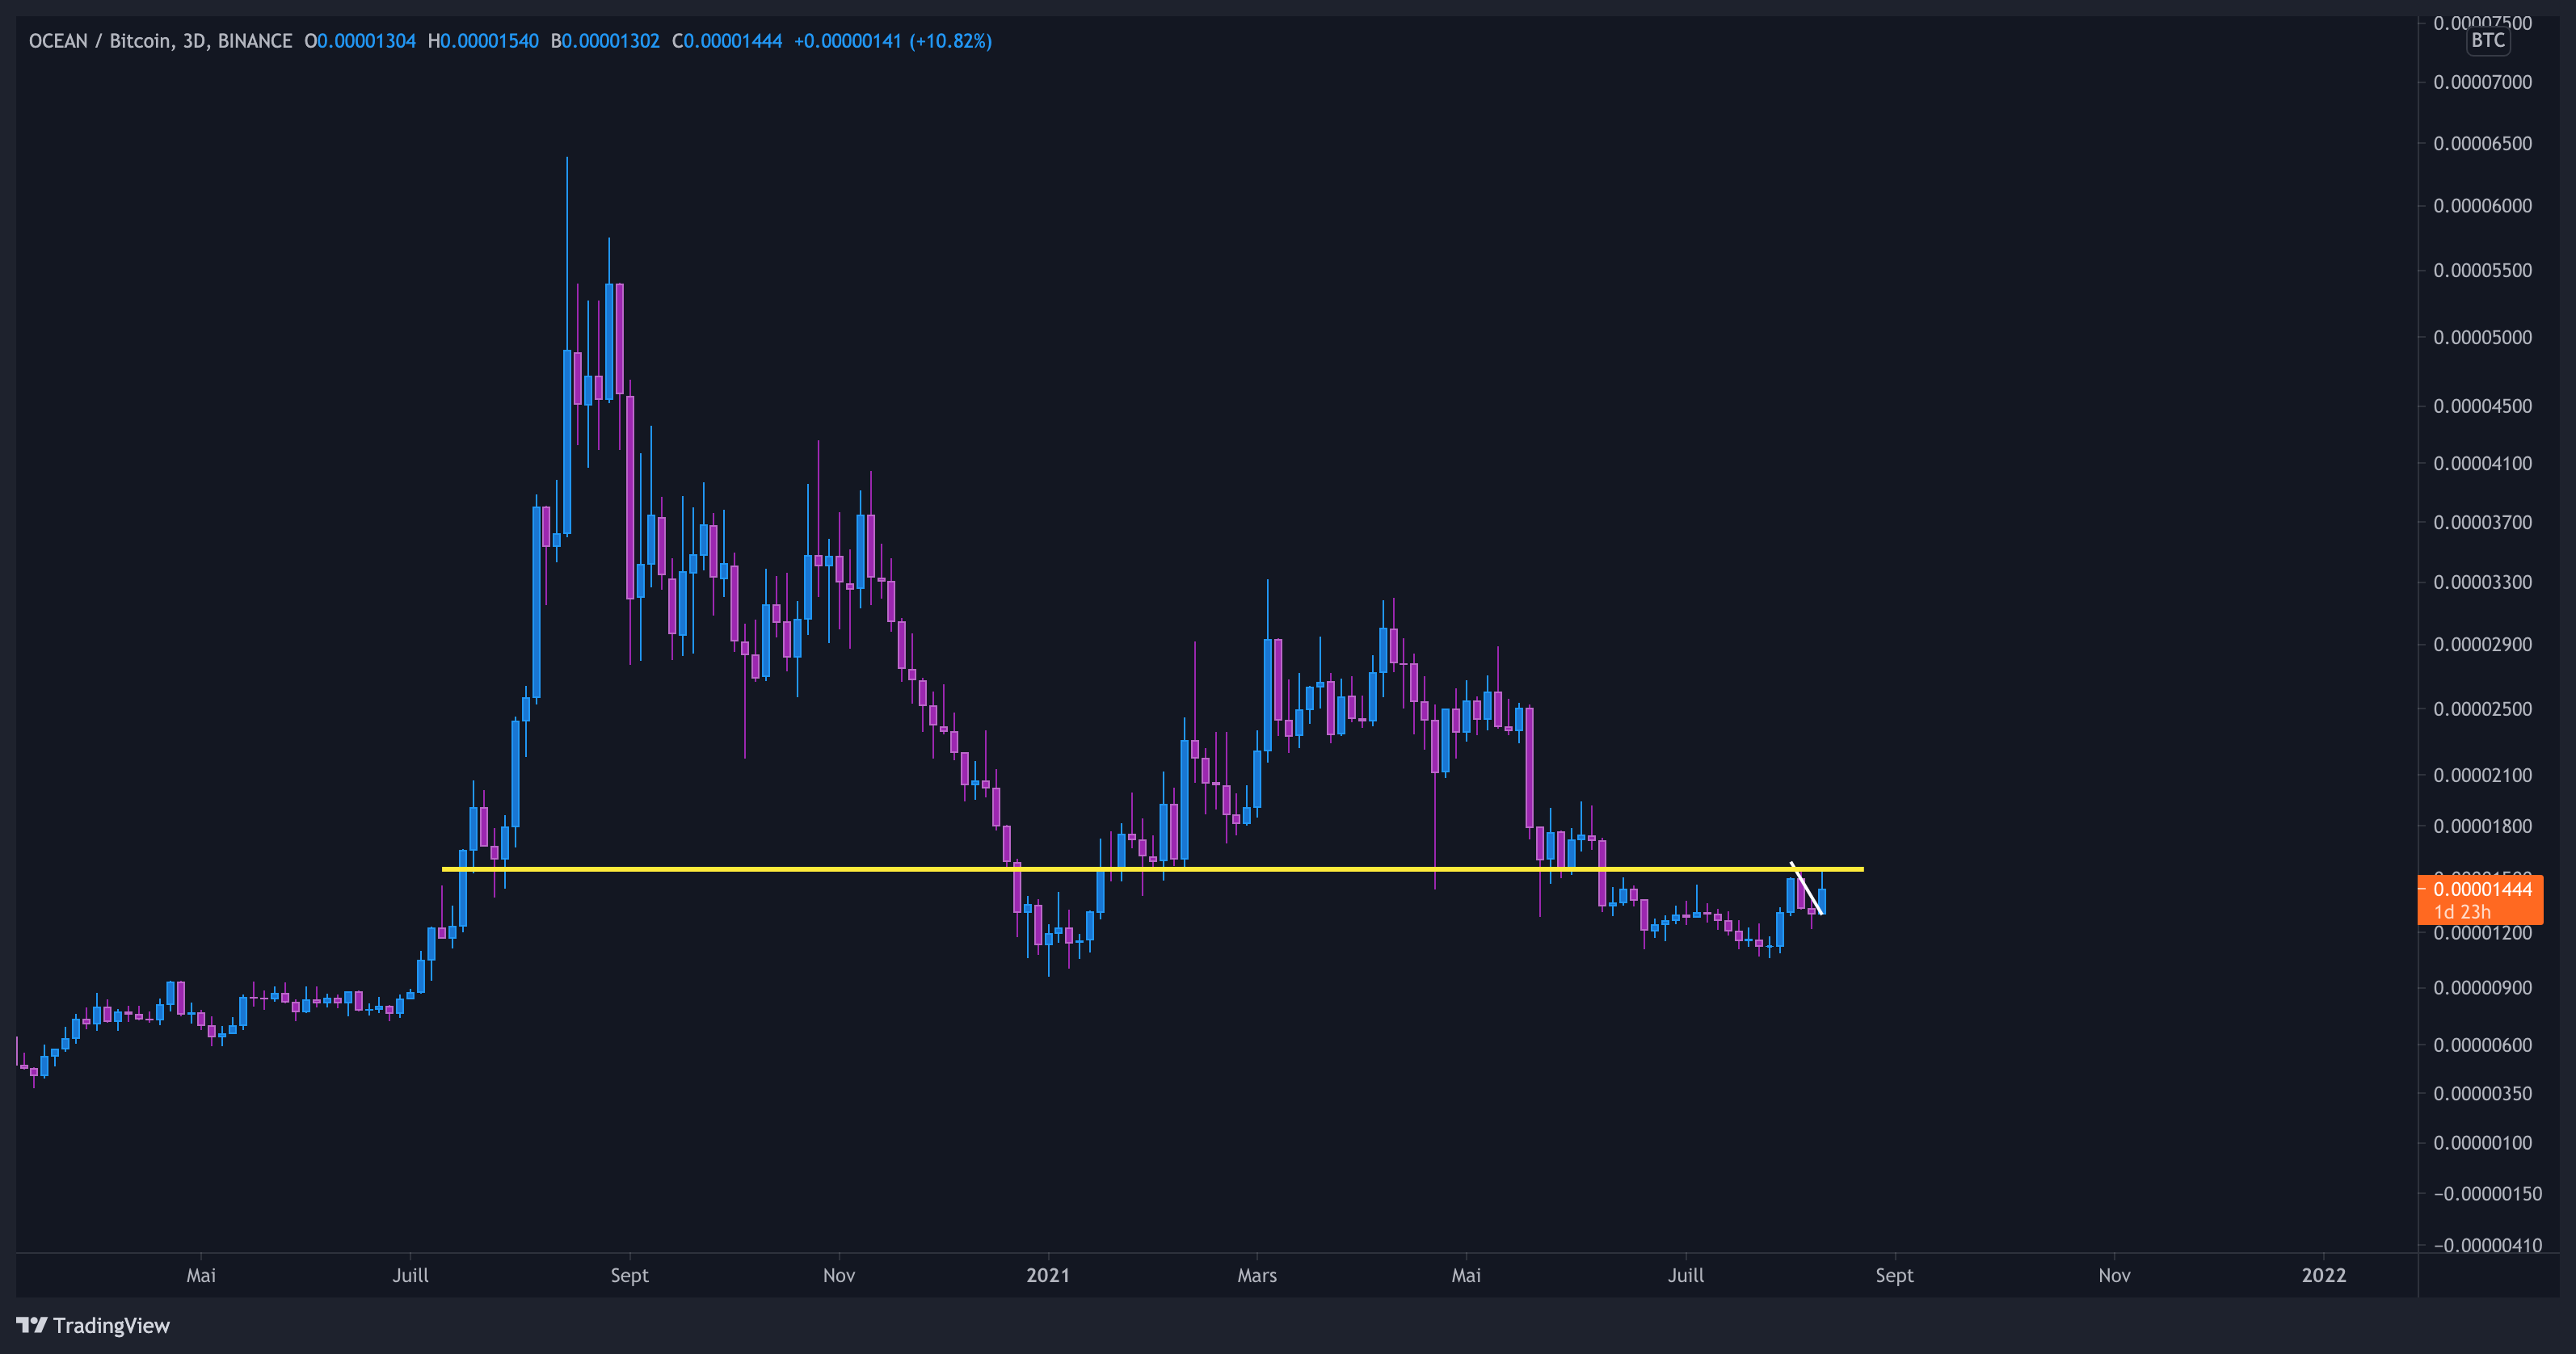
This level is definitely a reversal level. Once it’l break, x2 will come very fast on this chart imo.
Overall,
both OCEAN chart (BTC and USDT) looks very bullish for me. As I already said, Ocean Protocol reminds me of LINK in the way it develops. Uptrend, consolidation, breakout.. theses chart are very clean and to be honest very easy to play level by level.
I know we’re still far from ATH but past weeks we saw good momentum and it looks like investors took the opportunity of theses low price before bull market officially resume.
WE ARE GOING TO MAKE IT AND PARTICIPATE IN A DATA REVOLUTION.
Give Away


To participate, you will have to follow Me + L’(Ape) Baguette 🥖 and RT this tweet!
And the winner is… Gekko (@gekko_gordi)!
Congrats! I’ll contact you on Twitter :)
If you like it, don’t forget to subscribe, share and follow theses account on Twitter: @AnthoXBT & @ApeBaguette