

Bitcoin Technical Analysis Update - Week 38
Bitcoin Technical Analysis Update - Week 38
After trading in the same range, the opening of the week proved complicated for bitcoin with a correction of over $3000. Will the rest of the week recover from this move?

Summary
Previous Analysis
The Range
VPVR & POC
Fibonacci Levels
Weekly Close
Fear & Greed Index
Weekly Plan
7.1 First scenario
7.2 Second scenarioOverall
BTD 🔥
1. Previous Analysis
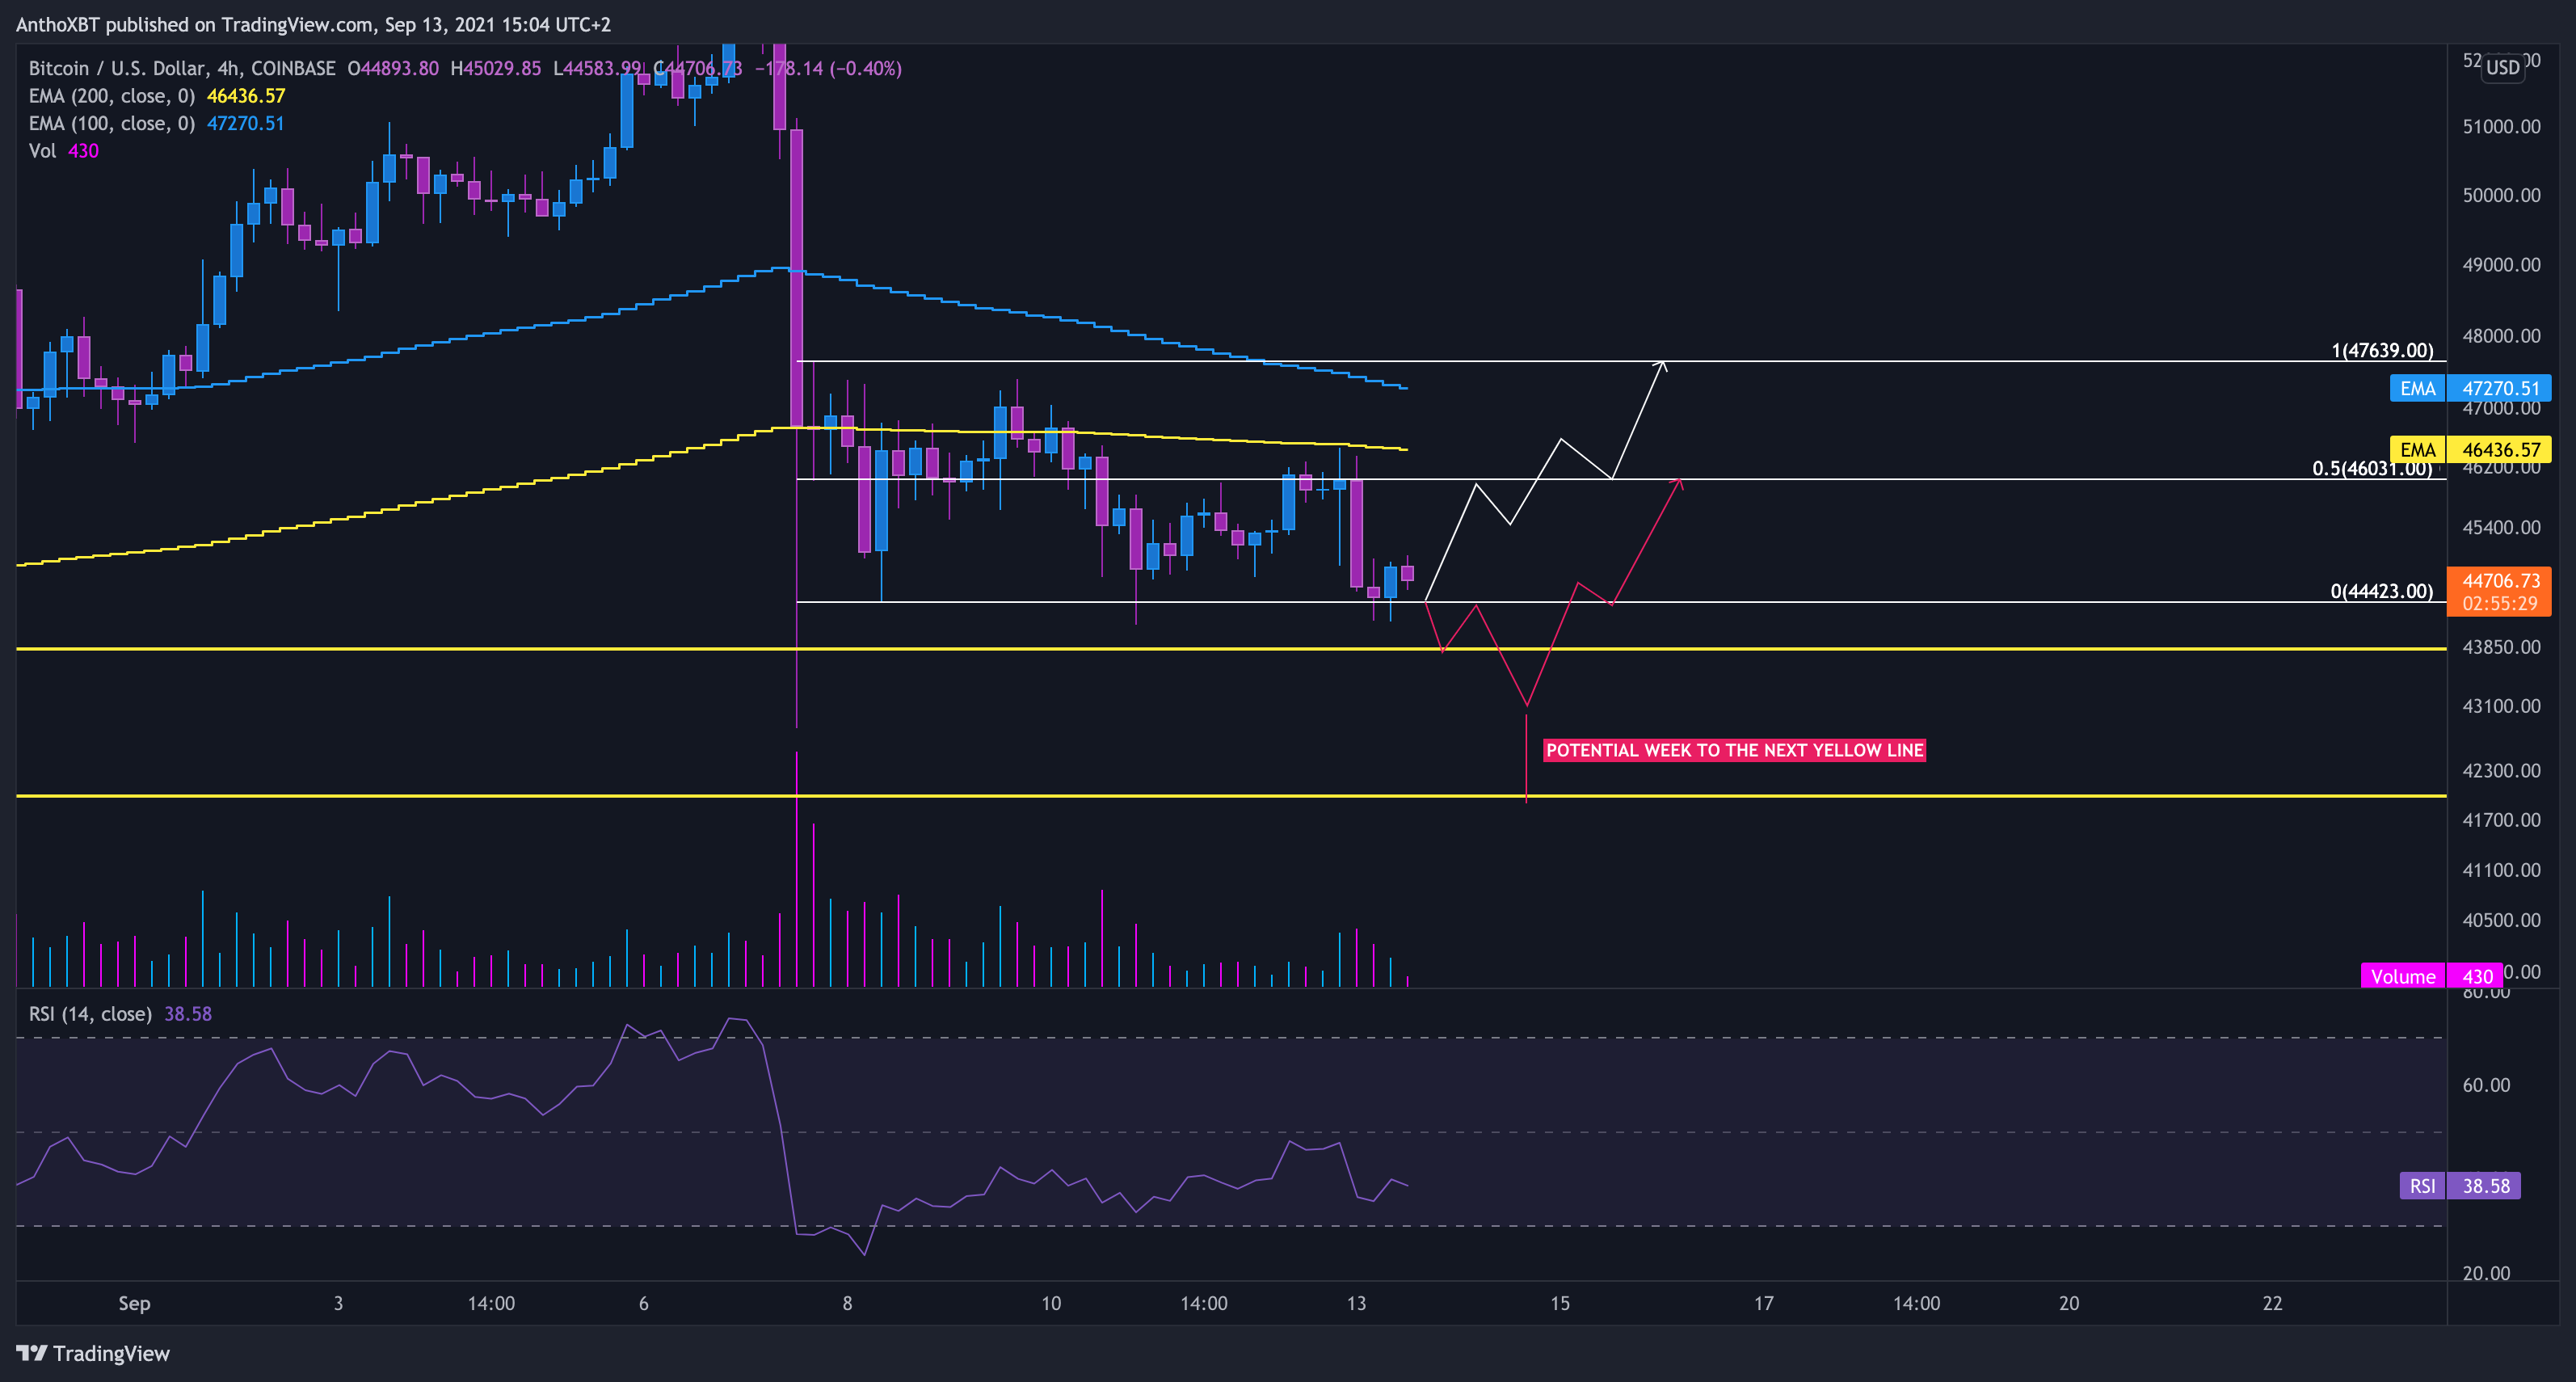
In my last Bitcoin technical analysis, I shared theses ideas for the previous week. This range played perfectly and Bitcoin followed the white path like a god:


After few attempts to break range-high, Bitcoin totally failed the last attempt and dump more than $3,500 while I’m writing this. Furthermore, the last H4 closes were below the previous range low BUT above the previous wick low. Let me explain.
2. The Range

Here it is. The Range. As you can see, Bitcoin moved inside for more than a week after its bug dump from $53,000. So, as I said above, bulls failed to manage a clean and strong breakout of the range-high and bears took control to push the price down and break the low.
But, the is two important wicks that touched important level previously, the first one from the big dump and the second one on the Walmart fake news. Theses two levels are the current important support area before the main level at $42,000.
3. VPVR & POC
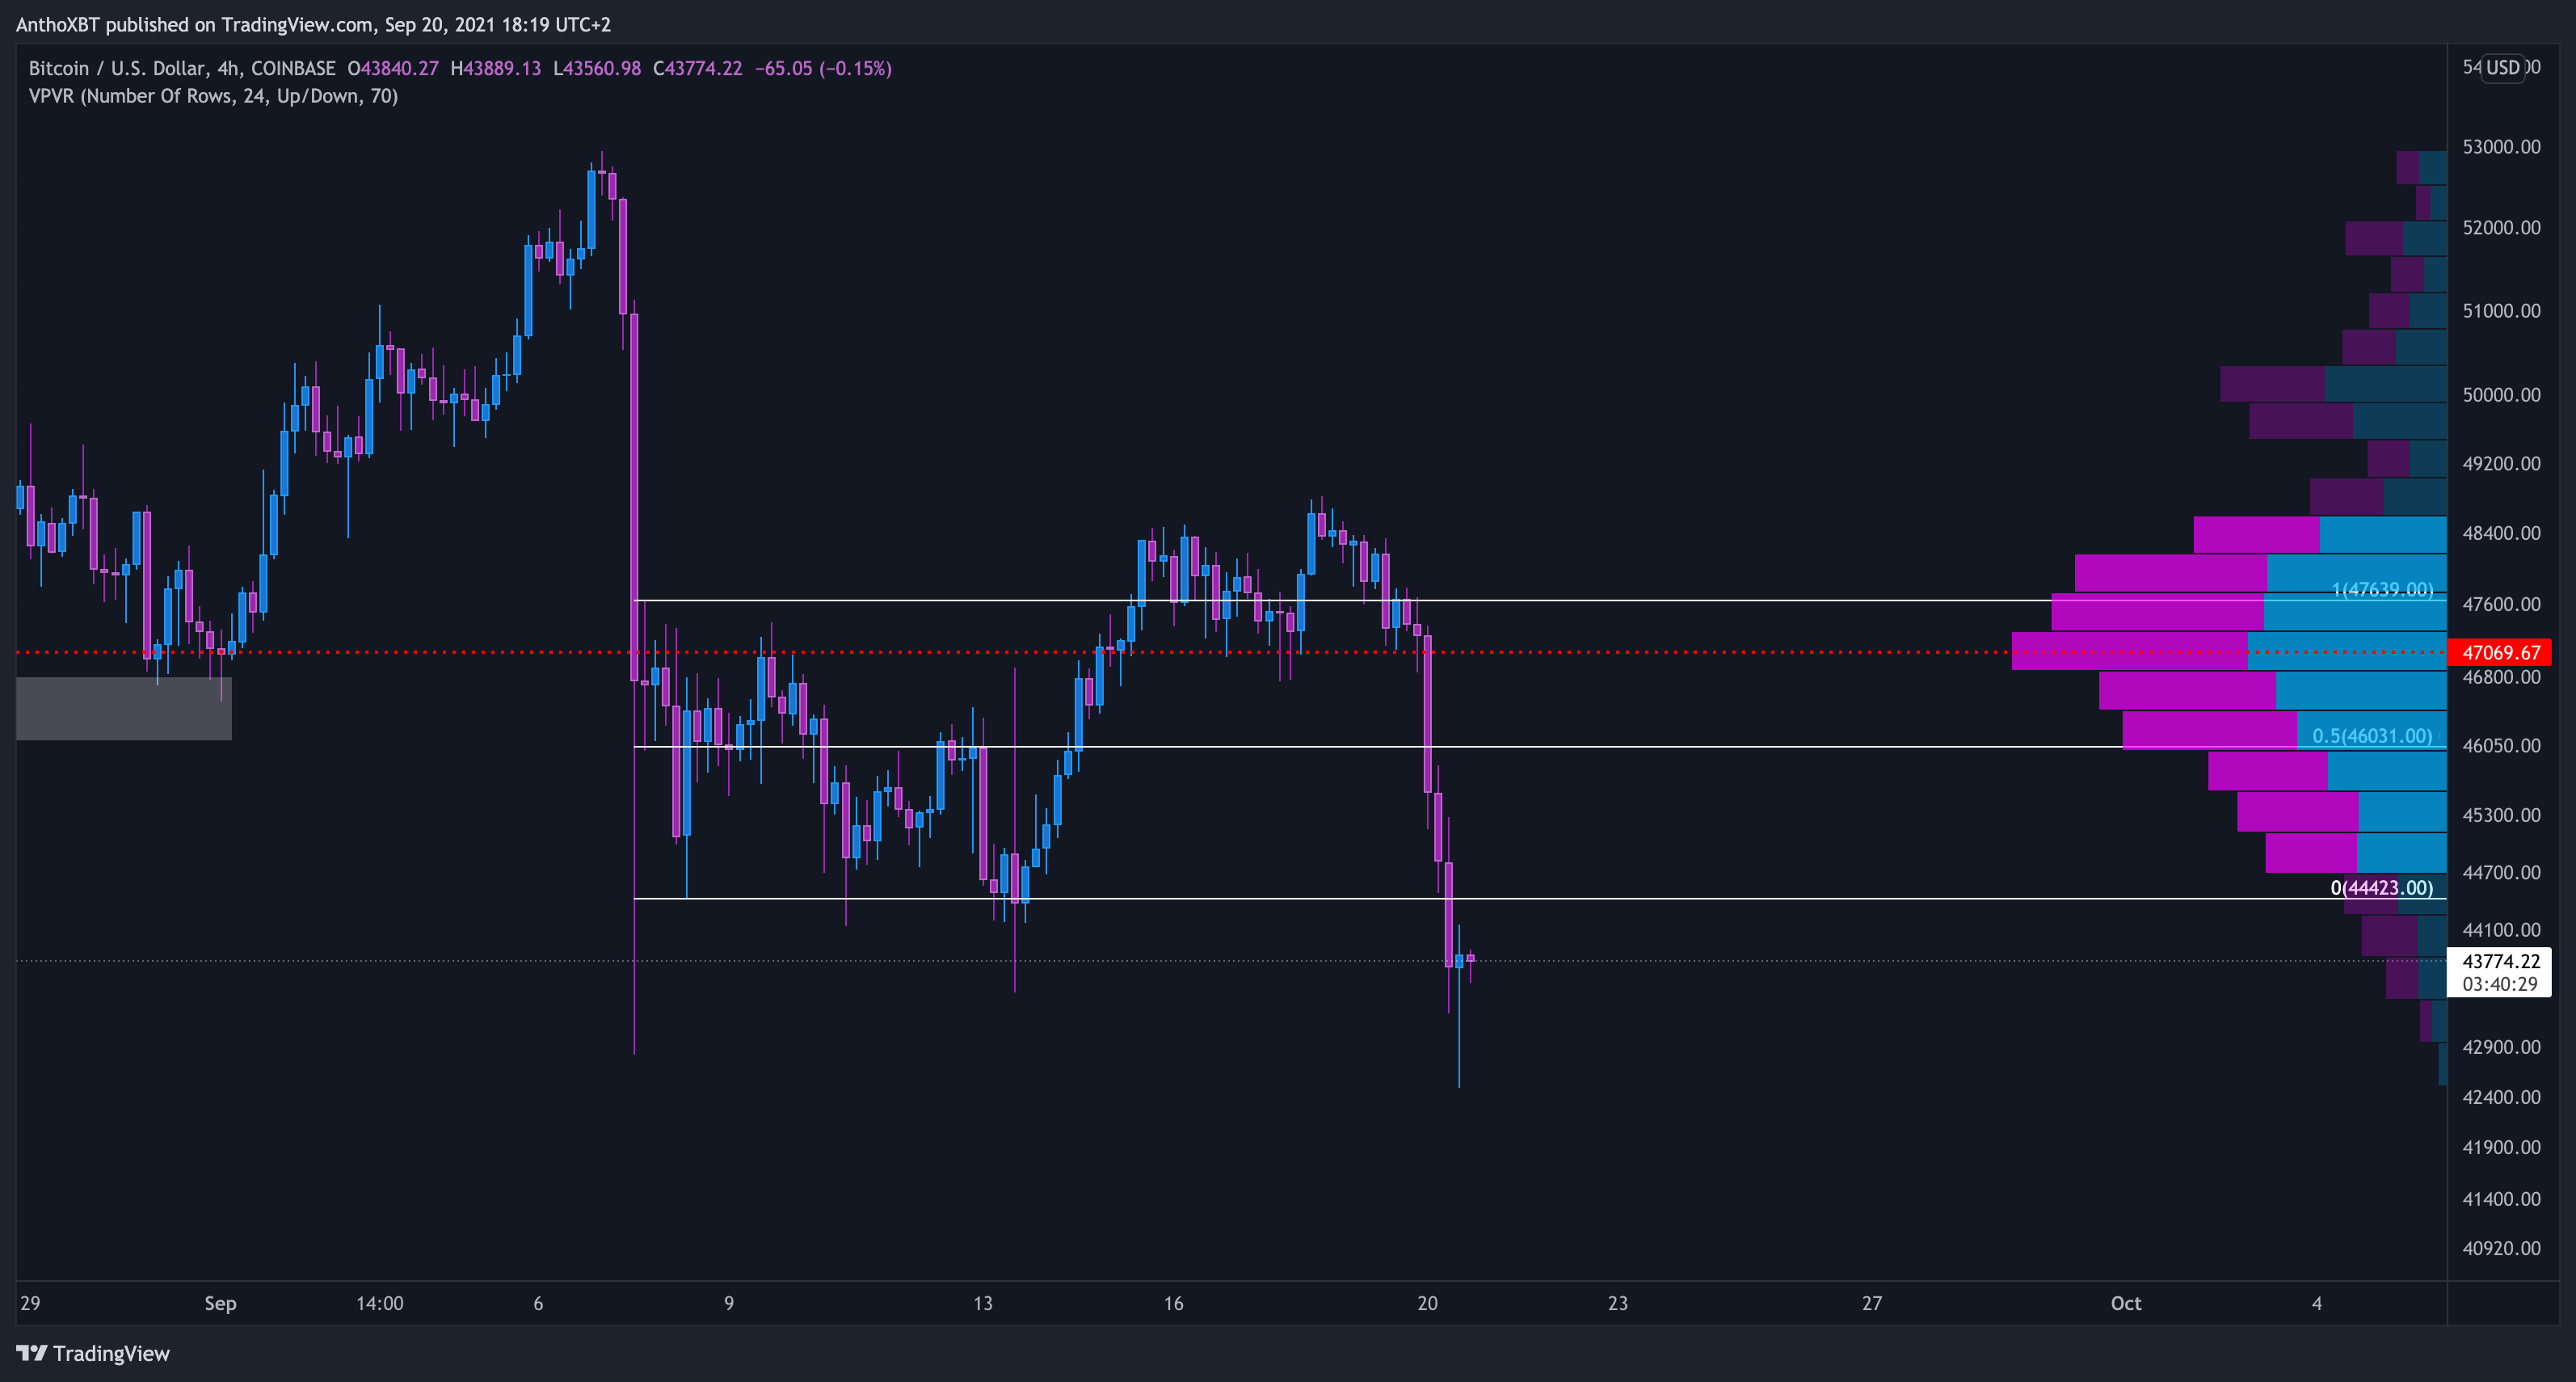
Current POC is at $47,000, the previous local support below the range-high. $47,000 is a key level for Bitcoin before $50,000 and $53,000. I think we’ll see some ranging/choppy days between $42,000 and $47,000 and this, could be good for altcoins.
4. Fibonacci Levels

$42,500, the level where Bitcoin bounce back this morning was not insignificant. It was the 0.382 fib level, and this is the level/area bulls need to hold, otherwise it’ll be very difficult to take over bears.
5. Weekly Close
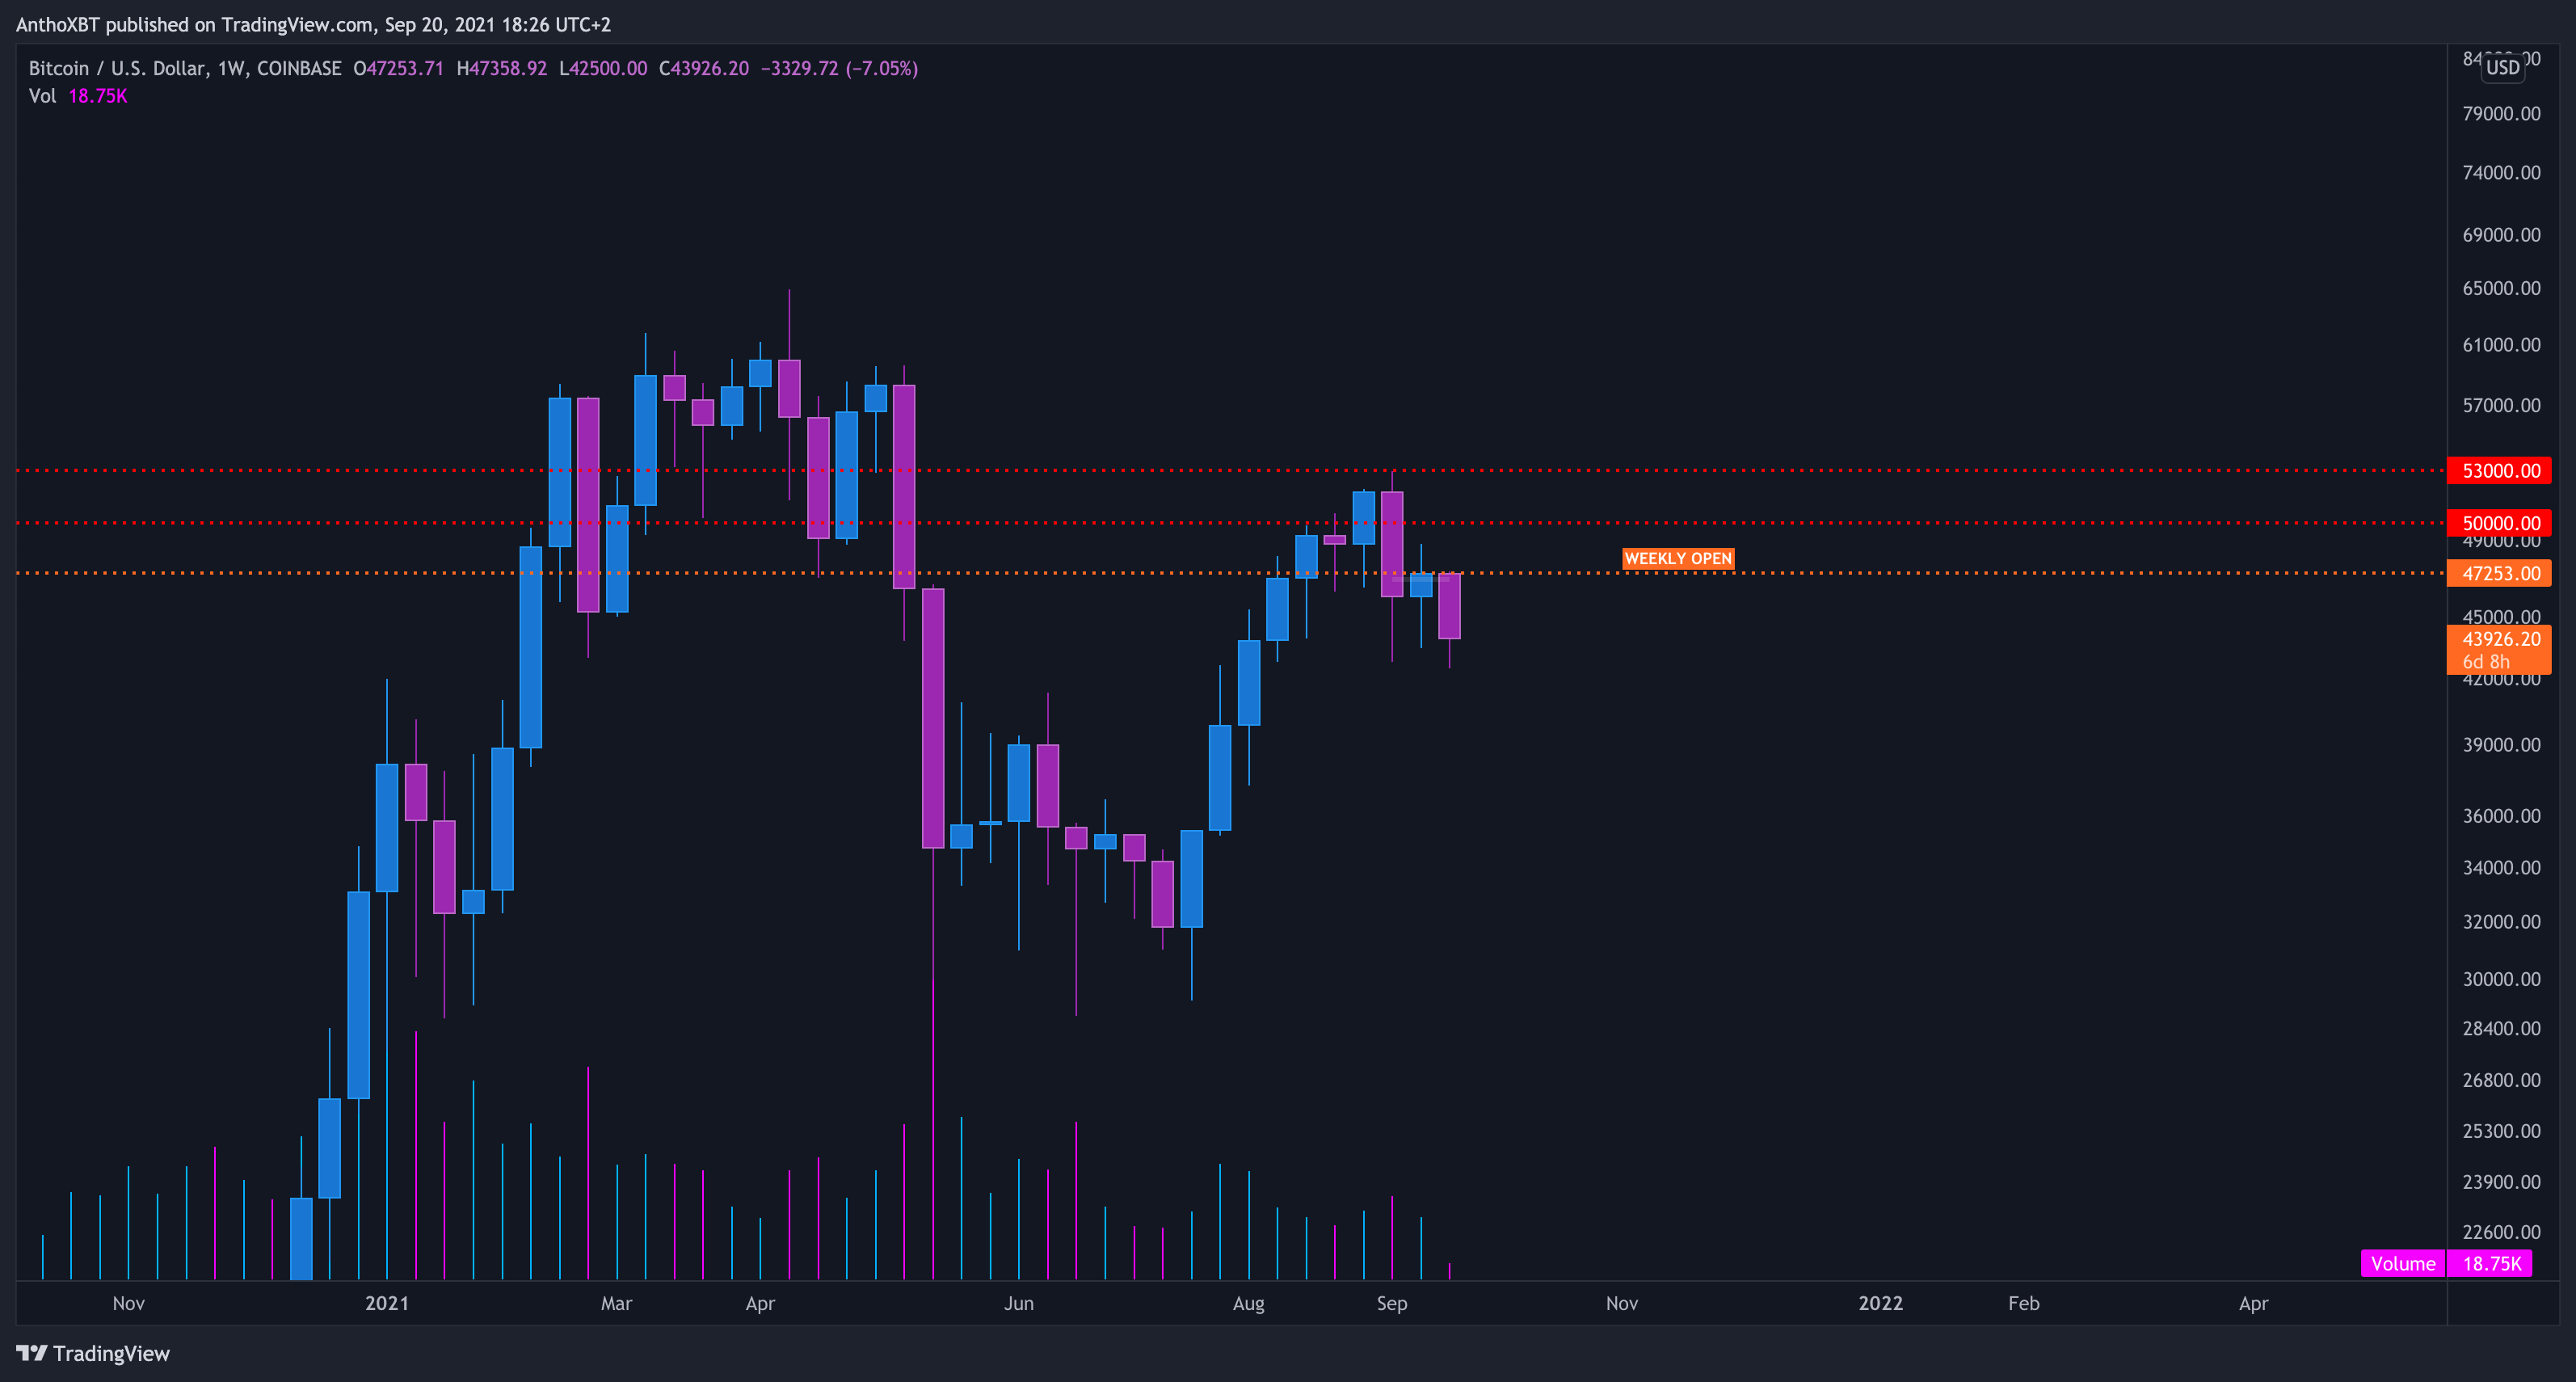
Yes, it doesn’t look really beautiful but now worries, it’s not too bad. As long as $42,000 hold on DAILY/WEEKLY, bulls can do their things and pump the corn. As this morning dump headed to $42,000 area, I’m not sure we’ll see this level retested again if we bounce today. Bitcoin is deeply oversold on many time frame.
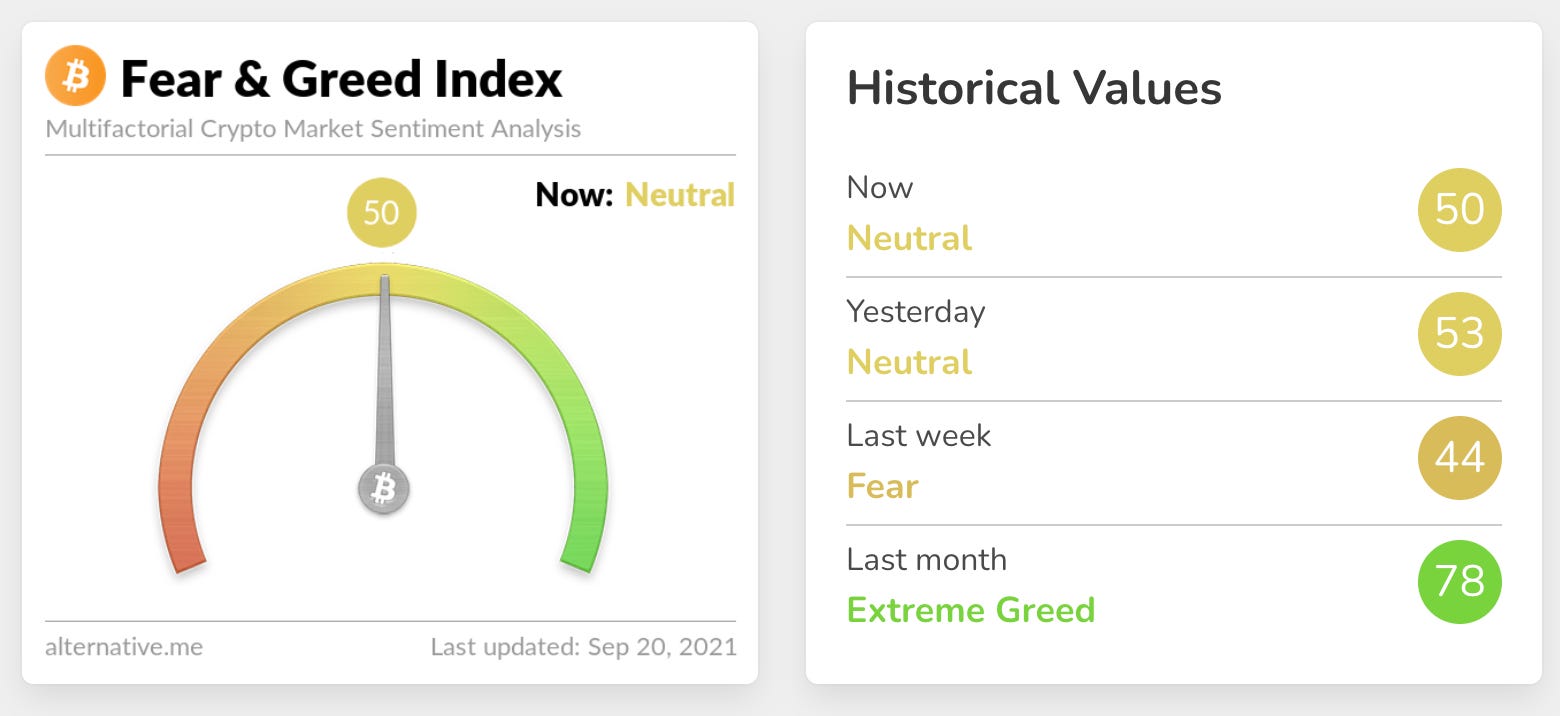
6. Fear & Green Index
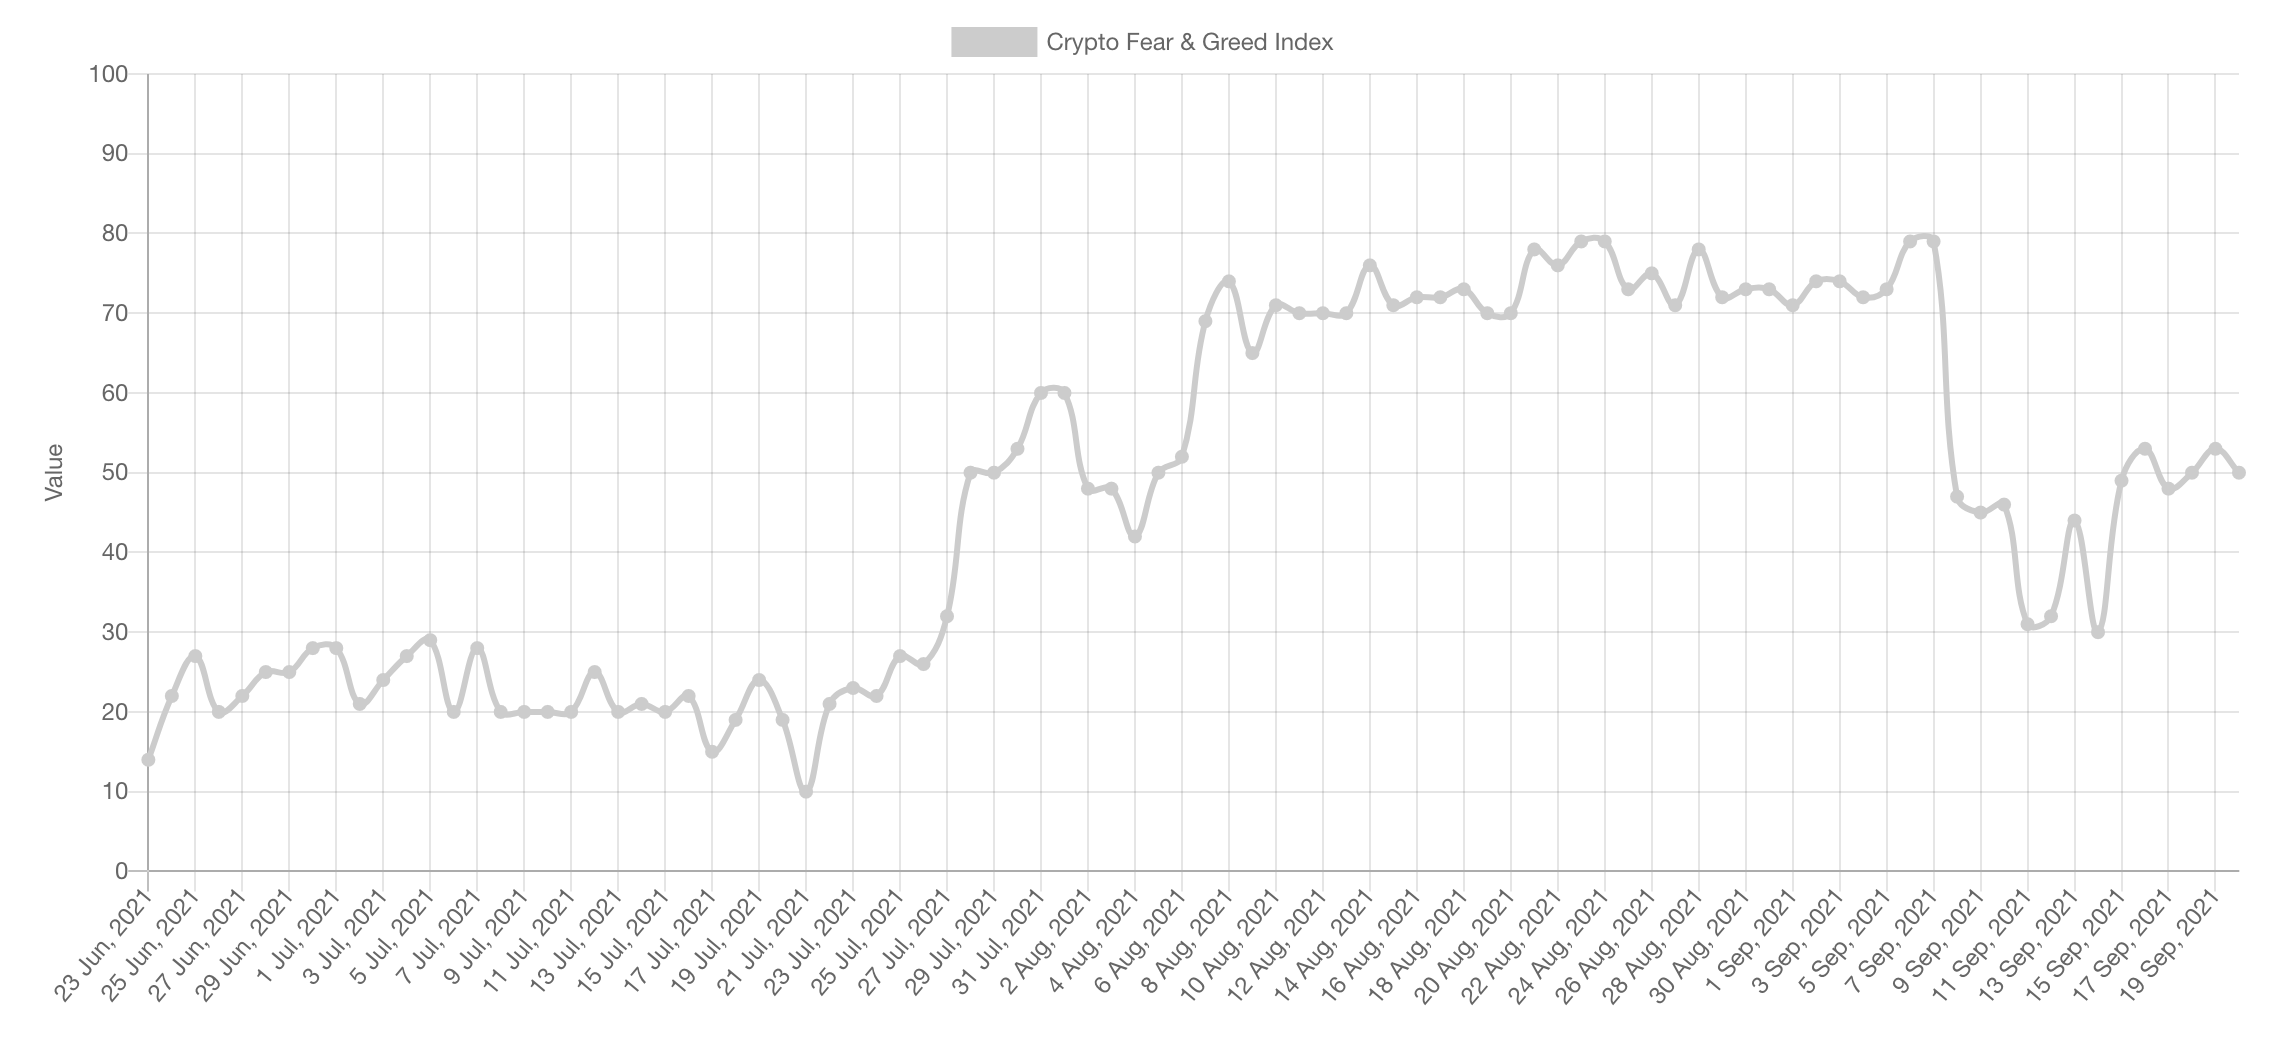
Nothing better than this indicator to know the market sentiment at a glance. Today, we’re neutral. This shows the incertitude on Bitcoin and why trading is choppy. If you’re not a scalper and experienced trader, you should just watch.
7. Weekly Plan
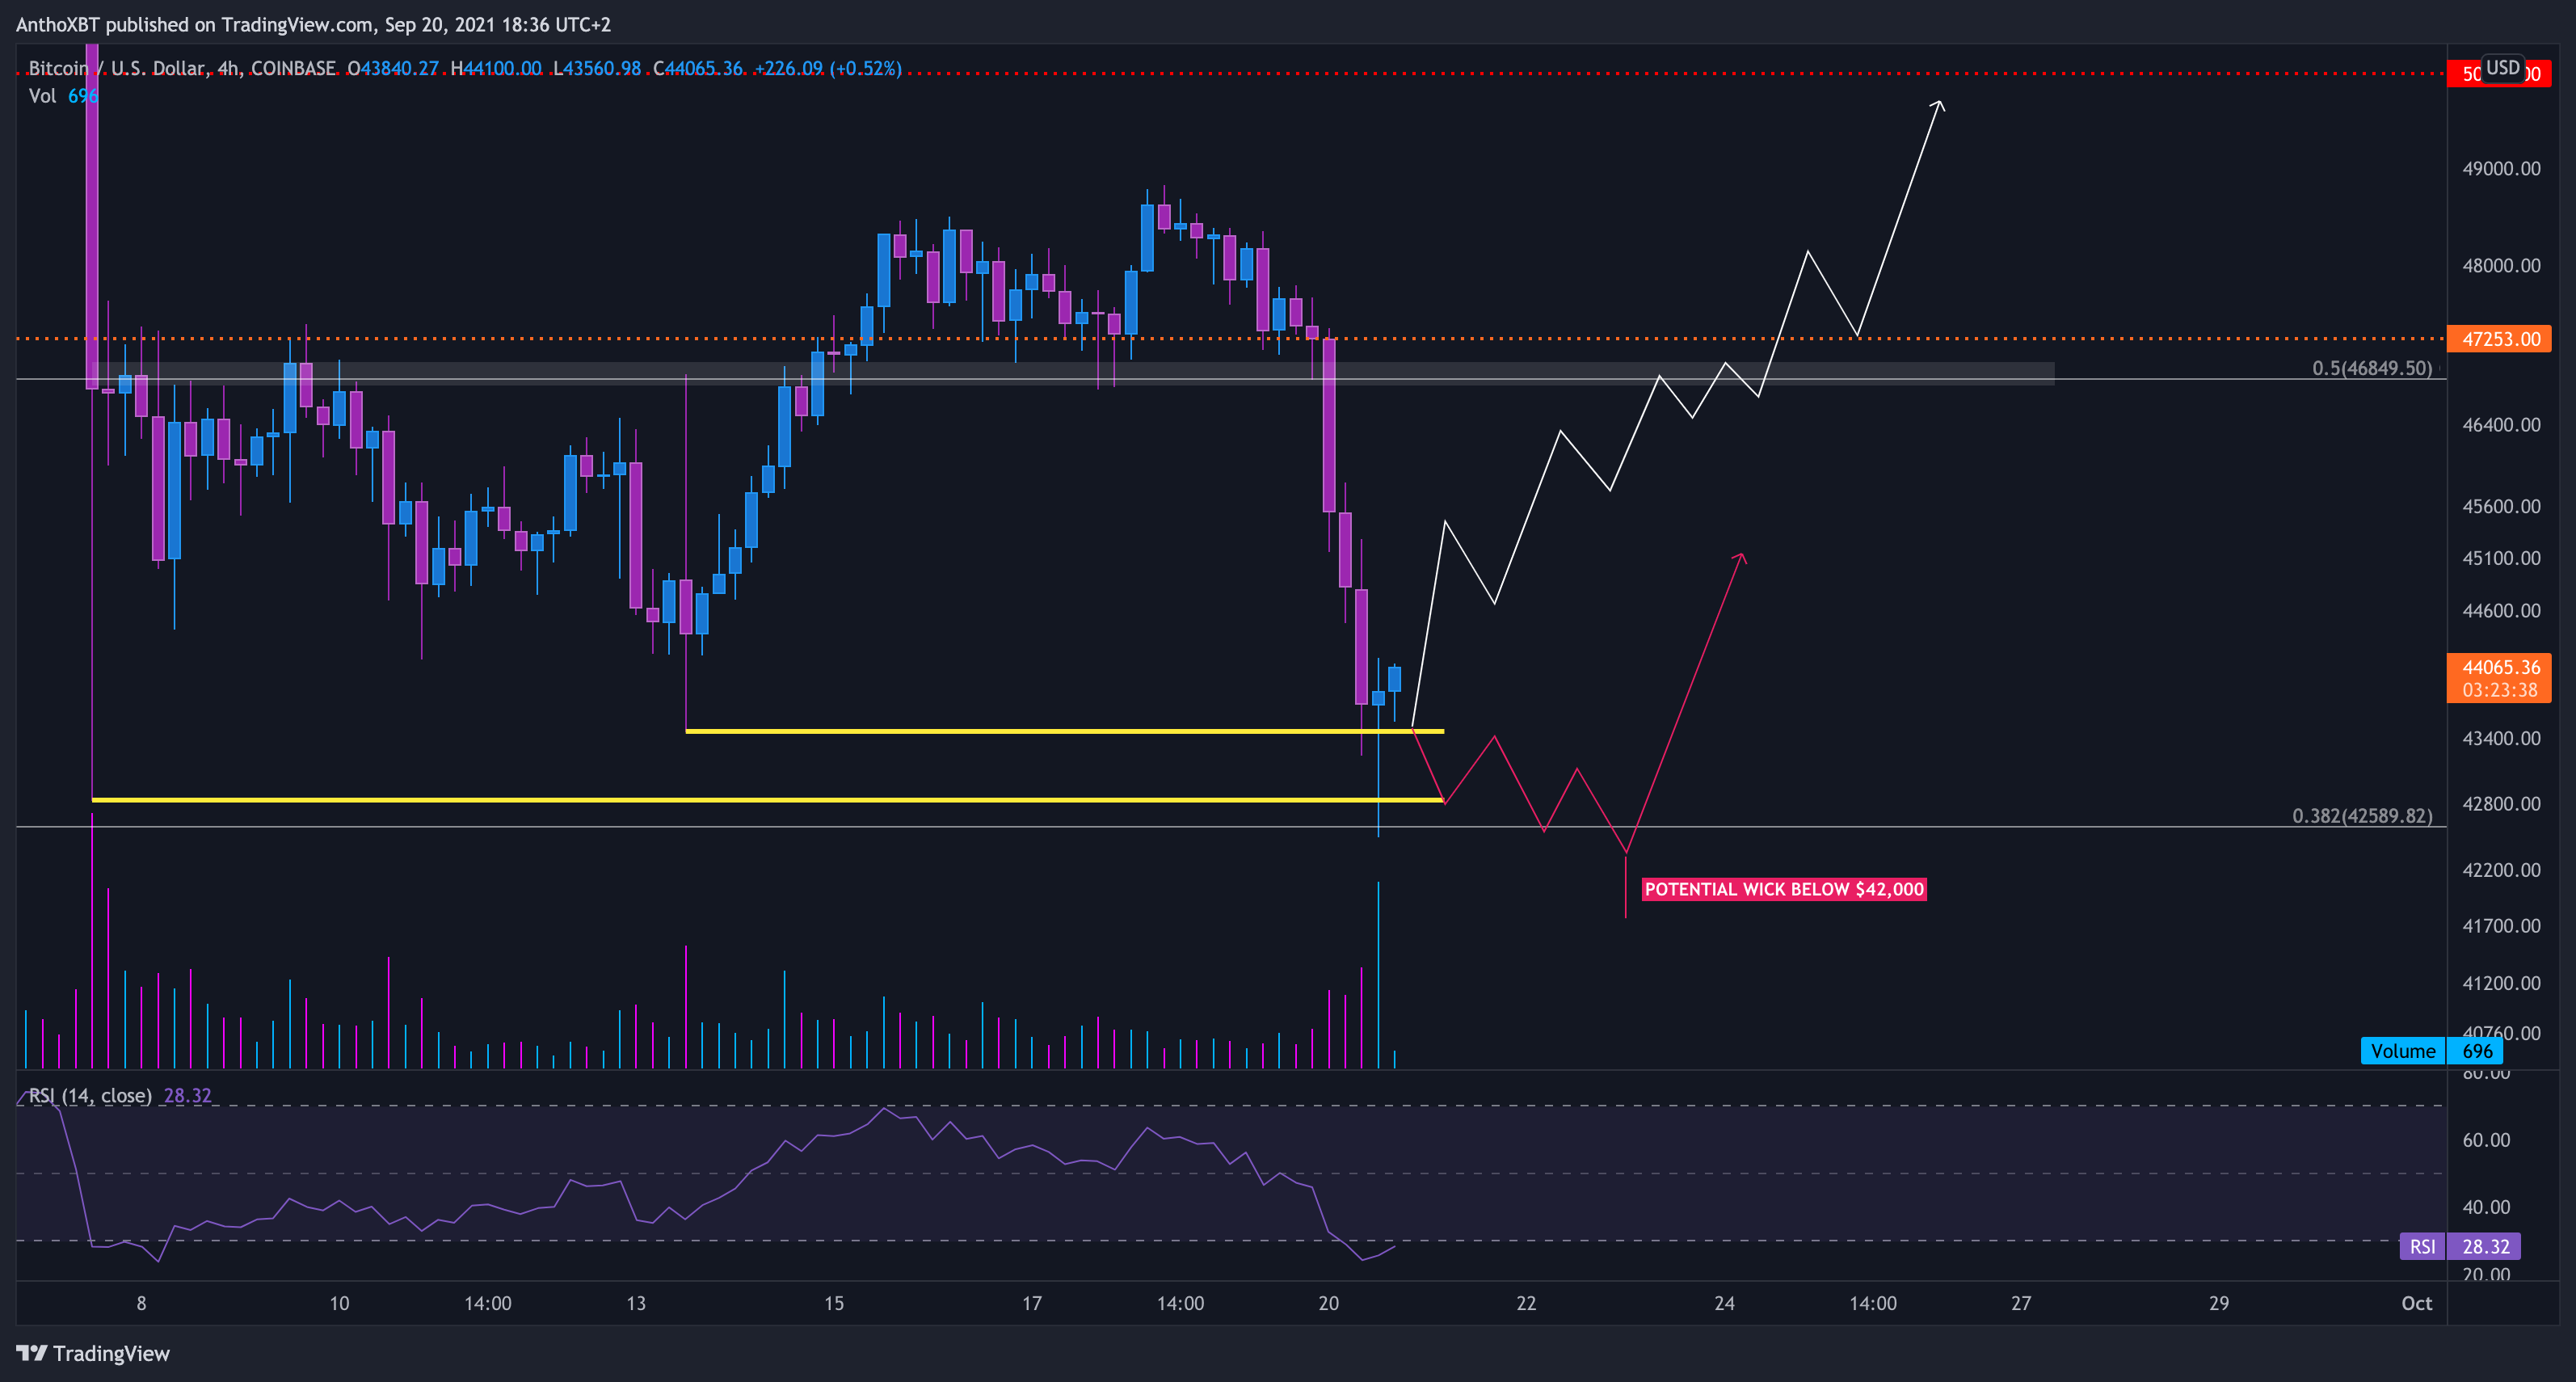
7.1. First scenario:
This area hold and Bitcoin bounce back toward $45,000/$46,000
Small pullback/consolidation and bullish continuation toward $47,000/weekly open
Consolidation near this level and back on track toward $50,000
7.2. Second scenario:
Theses supports don’t hold and Bitcoin breakdown followed by a bearish retest
Downward continuation with a potential wick below $42,000 before a real bull action toward $47,000
Note: If the bearish scenario occurs, we could go lower. Both scenarios above have been drawn considering that Bitcoin is able to hold the key $42,000 area.
8. Overall,
we all know how September can be a bad month based on Bitcoin history. But you know what comes next, the bullish Q4. Historically speaking, the last quarter of the year offers a nice market explosion, especially for altcoin, which performs superbly once Bitcoin has found its range and stabilized after a potential new ATH.
There is two more weeks to manage your portfolio and buy the dip, let Bitcoin. do is things and keep accumulating project with good fundamental as LUNA, DOT, LINK etc.. you’ll be rewarded (and fastest than you think)
9. BTD (Buy The Dip) 🔥
You asked us, we did it! We have joined forces to create a premium group where you will find short and long term calls for your trading and portfolio! You can also ask us your questions to improve your trading, we will help you as much as possible!
For now, registrations are close but you can join the waiting list for the next batch here:
If you like it, don’t forget to subscribe, share and follow theses account on Twitter: @AnthoXBT & @ApeBaguette